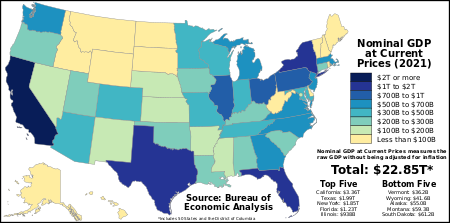
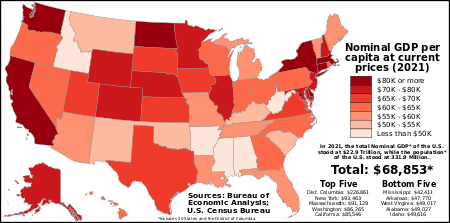
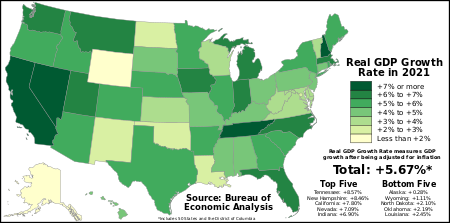
قائمة الولايات والأقاليم الأمريكية حسب ن.م.إ.
This is a list of U.S. states and territories by Gross Domestic Product (GDP). This article presents the 50 U.S. states and the District of Columbia and their nominal GDP at current prices.
The data source for the list is the Bureau of Economic Analysis (BEA) in 2022. The BEA defined GDP by state as "the sum of value added from all industries in the state."[1]
Nominal GDP does not take into account differences in the cost of living in different countries, and the results can vary greatly from one year to another based on fluctuations in the exchange rates of the country's currency. Such fluctuations may change a country's ranking from one year to the next, even though they often make little or no difference in the standard of living of its population.[2]
Overall, in the calendar year 2022, the United States' Nominal GDP at Current Prices totaled at $25.463 Trillion, as compared to $23.315 Trillion in 2021.
The three U.S. states with the highest GDPs were California ($3.6 Trillion), Texas ($2.356 Trillion), and New York ($2.053 Trillion). The three U.S. states with the lowest GDPs were Vermont ($40.6 Billion), Wyoming ($47.4 Billion), and Alaska ($63.6 Billion).
GDP per capita also varied widely throughout the United States in 2022, with New York ($105,226), Massachusetts ($99,274), and North Dakota ($96,461) recording the three highest GDP per capita figures in the U.S., while Mississippi ($47,572), Arkansas ($54,644), and West Virginia ($54,870) recorded the three lowest GDP per capita figures in the U.S. The District of Columbia, though, recorded a GDP per capita figure far higher than any U.S. state in 2022 at $242,853.
. . . . . . . . . . . . . . . . . . . . . . . . . . . . . . . . . . . . . . . . . . . . . . . . . . . . . . . . . . . . . . . . . . . . . . . . . . . . . . . . . . . . . . . . . . . . . . . . . . . . . . . . . . . . . . . . . . . . . . . . . . . . . . . . . . . . . . . . . . . . . . . . . . . . . . . . . . . . . . . . . . . . . . . .
الخمسون ولاية ومنطقة كلومبيا
The table below lists the annual Nominal GDP of each U.S. state and the District of Columbia in 2022, as well as the GDP change and GDP per capita for that year. The list is initially sorted by Nominal GDP in 2021, but clicking the table headers can sort any column.[1][3] The total for "United States" in this table excludes the U.S. territories.
The raw GDP data below is measured in Millions of U.S. Dollars
The GDP data below reflects the annual 2022 GDP totals.
* indicates "GDP of STATE or FEDERAL DISTRICT" or "Economy of STATE or FEDERAL DISTRICT" links.
| State or federal district | Nominal GDP at current prices 2022 (millions of U.S. dollars)[1] |
Annual GDP change at current prices 2022 (21–22)[1] |
Real GDP growth rate (2021–2022)[1] |
Nominal GDP per capita 2022[1][3] | % of national[1] | ||||
|---|---|---|---|---|---|---|---|---|---|
| 2022 | 2021 | 2022 | 2021 | 2022 | 2021 | ||||
| 3,598,103 | 3,373,241 | ▲ 224,862 | ▲ 11.6% | ▲ 7.8% | $92,190 | $85,316 | 14.69% | 14.49% | |
| 2,355,960 | 2,051,769 | ▲ 304,191 | ▲ 32.6% | ▲ 5.6% | $78,456 | $70,398 | 8.69% | 8.55% | |
| 2,053,180 | 1,901,297 | ▲ 151,883 | ▲ 7.5% | ▲ 5.0% | $104,344 | $94,118 | 8.11% | 8.31% | |
| 1,389,070 | 1,255,558 | ▲ 133,482 | ▲ 10.9% | ▲ 6.9% | $62,446 | $58,295 | 5.37% | 5.34% | |
| 1,033,310 | 945,674 | ▲ 87,636 | ▲ 9.3% | ▲ 5.0% | $82,126 | $73,811 | 4.11% | 4.13% | |
| 923,089 | 844,496 | ▲ 78,593 | ▲ 8.7% | ▲ 4.4% | $71,160 | $64,951 | 3.67% | 3.72% | |
| 822,670 | 756,617 | ▲ 66,053 | ▲ 8.7% | ▲ 4.3% | $69,978 | $64,125 | 3.22% | 3.26% | |
| 755,698 | 691,627 | ▲ 64,071 | ▲ 9.7% | ▲ 5.8% | $69,253 | $64,571 | 2.99% | 3.00% | |
| 745,422 | 682,946 | ▲ 62,476 | ▲ 8.7% | ▲ 4.9% | $80,490 | $73,529 | 2.94% | 2.98% | |
| 730,072 | 662,121 | ▲ 67,951 | ▲ 11.0% | ▲ 6.7% | $68,243 | $63,427 | 2.87% | 2.84% | |
| 725,514 | 677,489 | ▲ 48,025 | ▲ 10.5% | ▲ 6.7% | $93,193 | $87,928 | 2.92% | 2.91% | |
| 688,392 | 641,332 | ▲ 47,060 | ▲ 9.3% | ▲ 6.4% | $98,609 | $91,240 | 2.79% | 2.81% | |
| 649,393 | 604,958 | ▲ 44,435 | ▲ 7.7% | ▲ 4.0% | $74,789 | $70,091 | 2.59% | 2.65% | |
| 620,696 | 572,206 | ▲ 48,490 | ▲ 10.3% | ▲ 6.2% | $61,859 | $56,783 | 2.49% | 2.48% | |
| 484,372 | 436,359 | ▲ 48,013 | ▲ 10.3% | ▲ 5.8% | $82,954 | $75,586 | 1.85% | 1.84% | |
| 475,755 | 427,125 | ▲ 48,630 | ▲ 13.2% | ▲ 8.6% | $67,473 | $61,812 | 1.83% | 1.78% | |
| 470,187 | 443,930 | ▲ 26,257 | ▲ 6.7% | ▲ 3.2% | $76,279 | $71,868 | 1.92% | 1.98% | |
| 458,950 | 420,027 | ▲ 38,923 | ▲ 10.0% | ▲ 5.3% | $62,365 | $58,736 | 1.80% | 1.80% | |
| 455,750 | 412,975 | ▲ 42,775 | ▲ 12.0% | ▲ 6.9% | $66,698 | $60,865 | 1.84% | 1.81% | |
| 446,500 | 412,459 | ▲ 34,041 | ▲ 10.2% | ▲ 5.7% | $78,100 | $72,285 | 1.80% | 1.80% | |
| 401,792 | 368,611 | ▲ 33,181 | ▲ 8.4% | ▲ 3.8% | $68,192 | $62,550 | 1.60% | 1.63% | |
| 389,931 | 358,572 | ▲ 31,359 | ▲ 9.3% | ▲ 4.6% | $63,126 | $58,266 | 1.58% | 1.59% | |
| 321,845 | 298,395 | ▲ 23,450 | ▲ 7.3% | ▲ 4.2% | $88,760 | $82,772 | 1.30% | 1.33% | |
| 299,125 | 272,191 | ▲ 26,934 | ▲ 9.5% | ▲ 5.4% | $70,548 | $64,241 | 1.17% | 1.17% | |
| 295,880 | 269,802 | ▲ 26,078 | ▲ 10.3% | ▲ 5.9% | $56,066 | $52,716 | 1.18% | 1.18% | |
| 281,429 | 258,571 | ▲ 22,858 | ▲ 8.4% | ▲ 2.4% | $61,313 | $55,523 | 1.12% | 1.13% | |
| 277,817 | 254,110 | ▲ 23,707 | ▲ 8.9% | ▲ 4.1% | $54,753 | $50,579 | 1.08% | 1.09% | |
| 260,304 | 237,182 | ▲ 23,122 | ▲ 10.3% | ▲ 4.7% | $57,653 | $52,648 | 1.03% | 1.02% | |
| 248,176 | 225,340 | ▲ 22,836 | ▲ 11.5% | ▲ 6.7% | $73,424 | $68,890 | 0.96% | 0.95% | |
| 240,534 | 215,336 | ▲ 25,198 | ▲ 9.9% | ▲ 2.2% | $59,894 | $54,391 | 0.90% | 0.91% | |
| 231,108 | 216,860 | ▲ 14,248 | ▲ 13.2% | ▲ 6.4% | $72,221 | $67,981 | 0.96% | 0.94% | |
| 215,918 | 194,487 | ▲ 21,431 | ▲ 12.9% | ▲ 7.1% | $67,962 | $62,656 | 0.84% | 0.82% | |
| 210,670 | 191,381 | ▲ 19,289 | ▲ 9.8% | ▲ 3.8% | $71,729 | $65,162 | 0.84% | 0.84% | |
| 165,221 | 148,676 | ▲ 16,545 | ▲ 10.6% | ▲ 5.0% | $54,259 | $49,377 | 0.63% | 0.63% | |
| 161,702 | 146,285 | ▲ 15,417 | ▲ 12.7% | ▲ 5.3% | $82,207 | $74,597 | 0.66% | 0.64% | |
| 162,314 | 153,670 | ▲ 8,644 | ▲ 5.2% | ▲ 2.8% | $242,853 | $239,861 | 0.67% | 0.70% | |
| 138,740 | 127,308 | ▲ 11,432 | ▲ 9.9% | ▲ 4.4% | $47,190 | $42,994 | 0.55% | 0.55% | |
| 122,115 | 109,583 | ▲ 12,532 | ▲ 10.6% | ▲ 2.5% | $57,792 | $51,763 | 0.48% | 0.47% | |
| 109,546 | 96,283 | ▲ 13,263 | ▲ 12.5% | ▲ 5.8% | $56,496 | $52,356 | 0.41% | 0.40% | |
| 105,414 | 99,673 | ▲ 5,741 | ▲ 12.1% | ▲ 8.5% | $75,565 | $72,384 | 0.43% | 0.42% | |
| 98,219 | 91,096 | ▲ 7,123 | ▲ 8.7% | ▲ 4.6% | $68,207 | $62,608 | 0.39% | 0.40% | |
| 95,588 | 85,434 | ▲ 10,154 | ▲ 15.2% | ▲ 4.0% | $53,852 | $47,648 | 0.38% | 0.37% | |
| 87,525 | 81,160 | ▲ 6,365 | ▲ 6.5% | ▲ 3.7% | $85,977 | $82,062 | 0.35% | 0.37% | |
| 84,497 | 77,963 | ▲ 6,534 | ▲ 9.8% | ▲ 5.2% | $61,008 | $57,241 | 0.33% | 0.33% | |
| 73,267 | 63,560 | ▲ 9,707 | ▲ 15.6% | ▲ 2.1% | $94,021 | $81,581 | 0.28% | 0.26% | |
| 71,402 | 66,571 | ▲ 4,831 | ▲ 8.9% | ▲ 5.5% | $65,362 | $60,684 | 0.29% | 0.29% | |
| 67,571 | 61,685 | ▲ 5,886 | ▲ 11.7% | ▲ 4.9% | $74,268 | $69,569 | 0.27% | 0.26% | |
| 65,015 | 58,700 | ▲ 6,315 | ▲ 15.1% | ▲ 6.7% | $57,945 | $54,151 | 0.26% | 0.25% | |
| 63,618 | 57,349 | ▲ 6,269 | ▲ 10.3% | ▲ 0.3% | $86,722 | $78,197 | 0.24% | 0.24% | |
| 47,433 | 41,510 | ▲ 5,923 | ▲ 14.6% | ▲ 1.1% | $81,586 | $71,959 | 0.18% | 0.17% | |
| 40,617 | 37,104 | ▲ 3,513 | ▲ 8.2% | ▲ 3.5% | $62,771 | $57,697 | 0.16% | 0.16% | |
| 25,462,722 | 23,315,081 | ▲ 2,147 | ▲ 10.1% | ▲ 5.7% | $75,557 | $69,597 | 100% | 100% | |
U.S. territories
The Bureau of Economic Analysis (BEA) collects GDP data for four U.S. territories (American Samoa, Guam, the Northern Mariana Islands, and the U.S. Virgin Islands) separately from the states and the District of Columbia. Data for the U.S. territories is from the World Bank for GDP and GDP per capita, and from the Bureau of Economic Analysis for GDP growth (except Puerto Rico). All Puerto Rico data is from the World Bank.[4][5][6][7] GDP data for the Northern Mariana Islands is from 2019, so it is listed separately.
| Territory | Nominal GDP at Current Prices (millions of U.S. dollars) (2020) |
Real GDP growth rate (2020) | GDP per capita (2020) |
|---|---|---|---|
| $103,140 | $31,429 | ||
| $5,840 | $34,624 | ||
| $4,200 | $39,552 | ||
| $709 | ▲ 4.0% | $12,845 |
جزر شمال ماريانا
The Northern Mariana Islands GDP was $1.18 billion ($1,180 million) in 2019; GDP for the Northern Mariana Islands decreased by 11.2% in 2019; and GDP per capita in the Northern Mariana Islands was $20,659 in 2019.[5][4][6]
انظر أيضاً
- List of countries by GDP (nominal)
- Economy of the United States
- List of states by adjusted per capita personal income
- List of U.S. states and territories by economic growth rate
- List of U.S. state economies
- List of cities by GDP
- List of U.S. metropolitan areas by GDP
- List of U.S. metropolitan areas by GDP per capita
المراجع
- ^ أ ب ت ث ج ح خ "GDP by State". GDP by State | U.S. Bureau of Economic Analysis (BEA). Bureau of Economic Analysis. Retrieved 10 April 2022.
- ^ Moffatt, Mike. "A Beginner's Guide to Purchasing Power Parity Theory". About.com. IAC/InterActiveCorp. Retrieved 26 March 2021.
- ^ أ ب "New Vintage 2021 Population Estimates Available for the Nation, States and Puerto Rico". New Vintage 2021 Population Estimates Available for the Nation, States and Puerto Rico. United States Census Bureau. 21 December 2021. Retrieved 10 April 2022.
{{cite web}}: CS1 maint: url-status (link) - ^ أ ب https://data.worldbank.org/indicator/NY.GDP.PCAP.CD?locations=AS
https://data.worldbank.org/indicator/NY.GDP.PCAP.CD?locations=GU
https://data.worldbank.org/indicator/NY.GDP.PCAP.CD?locations=MP
https://data.worldbank.org/indicator/NY.GDP.PCAP.CD?locations=PR
https://data.worldbank.org/indicator/NY.GDP.PCAP.CD?locations=VI
World Bank - GDP Per Capita. American Samoa / Guam / Northern Mariana Islands / Puerto Rico / Virgin Islands (U.S.) Retrieved July 3, 2022. - ^ أ ب https://www.bea.gov/data/gdp/gdp-american-samoa
https://www.bea.gov/data/gdp/gdp-guam
https://www.bea.gov/data/gdp/gdp-commonwealth-northern-mariana-islands-cnmi
https://www.bea.gov/data/gdp/gdp-us-virgin-islands-usvi
Bureau of Economic Analysis. GDP for American Samoa / Guam / Commonwealth of the Northern Mariana Islands / U.S. Virgin Islands (USVI) [GDP growth rate]. Retrieved July 3, 2022. - ^ أ ب https://data.worldbank.org/indicator/NY.GDP.MKTP.CD?locations=AS
https://data.worldbank.org/indicator/NY.GDP.MKTP.CD?locations=GU
https://data.worldbank.org/indicator/NY.GDP.MKTP.CD?locations=MP
https://data.worldbank.org/indicator/NY.GDP.MKTP.CD?locations=PR
https://data.worldbank.org/indicator/NY.GDP.MKTP.CD?locations=VI
World Bank - GDP (current U.S. dollars) - American Samoa / Guam / Northern Mariana Islands / Puerto Rico / Virgin Islands (U.S.) Retrieved July 3, 2022. - ^ https://data.worldbank.org/indicator/NY.GDP.MKTP.KD.ZG?locations=PR&mod=article_inline
World Bank. GDP growth rate (Puerto Rico). Retrieved July 3, 2022.
وصلات خارجية
| Find more about Gross Domestic Product at Wikipedia's sister projects | |
| Definitions from Wiktionary | |
| Media from Commons | |
| Quotations from Wikiquote | |
| Source texts from Wikisource | |
| Textbooks from Wikibooks | |
| Learning resources from Wikiversity | |
- CS1 maint: url-status
- الصفحات بخصائص غير محلولة
- Short description is different from Wikidata
- Articles with hatnote templates targeting a nonexistent page
- Missing redirects
- Economy of the United States-related lists
- Gross state product
- Lists of states of the United States
- Ranked lists of country subdivisions


