Tag-article-test
| ديموغرافيا أوكرانيا | |
|---|---|
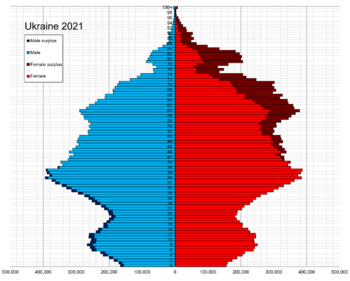 الهرم السكاني لأوكرانيا، 1 يناير 2021. | |
| السكان | 41.167.336 |
| معدل النمو | -6.6 |
| معدل المواليد | 8.1 |
| معدل الوفيات | 14.7 ▼ متوفى/1,.000 شخص (2019) |
| العمر المتوقع | 71.76 سنة ▲ (2018)[2] |
| • الذكور | 66.69 |
| • الإناث | 76.72 ▲ سنة |
| معدل الخصوبة | 1.30 |
| معدل وفيات الأطفال | 7.0 متوفى /1.000 ▼ طفل (2019)[2] |
| معدل الهجرة الصافي | −5.4 مهاجر/1.000 شخص (2015) |
| التركيبة العمرية | |
| 0–14 سنة | ▲ 15.4% |
| 15–64 سنة | |
| 65 وأكثر | ▲ 16.2% (2017) |
| النسبة بين الجنسين | |
| عند الميلاد | 1.06 ذكر/أنثى |
| تحت 15 | 1.06 ذكر/أنثى |
| 15–64 سنة | 0.92 ذكر/أنثى |
| 65 وأكثر | 0.51 ذكر/أنثى |
| الجنسية | |
| الجنسية | الاسم: أوكراني الصفة: أوكراني |
| الأغلبية العرقية | الأوكرانيون (77.8%) 2001[3] |
| الأقلية العرقية | الروس (17.3%) 2001[3] |
| اللغة | |
| الرسمية | الأوكرانية |
| المنطوقة | الأوكرانية، الروسية، أخرى |

تتضمن ديموغرافيا أوكرانيا إحصائيات النمو السكاني، الكثافة السكانية، العرقيات، مستوى التعليم، الصحة، الحالة الاقتصادية، الانتماءات الدينية، وجوانب أخرى لسكان أوكرانيا.
البيانات الواردة في هذا المقال حسب تعداد أوكرانيا 2011، وهو الأحدث،[4] كتاب حقائق العالم، واللجنة الإحصائية لدولة أوكرانيا. كان من المقرر عقد التعداد التالي في 2020 لكن تم تأجيله لعام 2023.[5][6]
في 1 يناير 2022 بلغ إجمالي تعداد سكان أوكرانيا 41.167.336 نسمة[2] باستثناء جمهورية القرم الذاتية وسڤاستوپول، والتي ضمتها القرم عام 2014. (في حال تضمين هذه المناطق في ديموغرافيا أوكرانيا، يرتفع عدد السكان من حوالي 2.25 مليون إلى 43.4 مليون نسمة).
أثناء الحرب في دونباس، فقدت الحكومة الأوكرانية أيضاً السيطرة على أجزاء منطقة الدونباس، والتي تتضمن مدن رئيسية مثل لوهانسك، دونيتسك وهورليڤكا. في حالة طرح أعداد سكان هذه المكن لديموغرافيا أوكرانيا الحالي، ينخفض إلى عدد السكان لأقل من 40 مليون نسمة. عام 2019، قدر تعداد إلكتروني أن عدد سكان أوكرانيا، باستثناء شبه جزيرة القرم وأجزاء من دونباس، سيكون 37.3 مليون نسمة.[7]
. . . . . . . . . . . . . . . . . . . . . . . . . . . . . . . . . . . . . . . . . . . . . . . . . . . . . . . . . . . . . . . . . . . . . . . . . . . . . . . . . . . . . . . . . . . . . . . . . . . . . . . . . . . . . . . . . . . . . . . . . . . . . . . . . . . . . . . . . . . . . . . . . . . . . . . . . . . . . . . . . . . . . . . .
البيانات التاريخية
في نهاية القرن السابع عشر كان هناك ما يقرب من أربعة ملايين أوكراني.[8] معظم البيانات التاريخية مأخوذة من Demoscope.ru.[9] تباينت أراضي أوكرانيا الحديثة بشكل كبير في الأوقات المذكورة أعلاه. كانت المناطق الغربية من أوكرانيا، غرب نهر زبروخ، حتى عام 1939 في معظم الأوقات جزءًا من مملكة گاليسيا وجمهورية پولندا لاحقاً. المعلومات التفصيلية عن تلك الأراضي مفقودة، لمزيد من المعلومات انظر ديموغرافيا پولندا. كما تغيرت السيطرة على شبه جزيرة القرم، عام 1897 كانت جزءًا من محافظة توريدا، لكن بعد ثورة أكتوبر أصبحت جزءًا من الروسية الاشتراكية السوڤيتية، ثم أصبحت لاحقًا تحت إدارة جمهورية أوكرانيا الاشتراكية السوڤيتية.
أراضي بودياك (بسارابيا الجنوبية) أصبحت في يونيو 1940 جزءاً من جمهورية أوكرانيا الاشتراكية السوڤيتية. أُجريت في جمهورية أوكرانيا الاشتراكية السوڤيتية تعدادات 1926 حتى 1989. أثجري تعداد عام 1897 بما يتوافق مع تسعة محافظات تضم أراضي أوكرانيا اليوم. إحصاءات 1906 مأخوذة من www.statoids.com الذي يقدم درجة واسعة من التفسير التاريخي للوضع في الإمبراطورية الروسية. تم تقدير إحصائيات التعداد السكاني لعام 1931 من قبل الأستاذ الأوكراني زنون كوزلا (1882–1952)[10] من برلين. حساباته اعتبارًا من 1 يناير 1931. هذا التحليل الإثنوجرافي مذكور في موسوعة أوكرانيا كأحد المصادر المتاحة فقط بسبب نقص التعداد الرسمي.[11][12]
كان تعداد عام 2001 الأول (وحتى الآن فقط[13]) التعداد الرسمي لأوكرانيا المستقلة. أخذت إحصائيات 2003-2009 بيانات من الموقع الرسمي للدولة الأوكرانية وتمثل البيانات اعتبارًا من فبراير من كل عام للسكان الحقيقيين.
المجاعات والهجرة
خلقت مجاعات الثلاثينيات، التي أعقبها دمار الحرب العالمية الثانية، كارثة ديمغرافية. انخفض متوسط العمر المتوقع عند الولادة إلى مستوى منخفض يصل إلى عشر سنوات للإناث وسبع سنوات للذكور في عام 1933 واستقر عند حوالي 25 للإناث و15 للذكور في الفترة 1941-1944.[14] بحسب دليل أكسفورد للحرب العالمية الثانية، "أكثر من 7 ملايين نسمة من سكان أوكرانيا، أكثر من سدس سكان ما قبل الحرب، لقوا حتفهم خلال الحرب العالمية الثانية".[15]
حدثت هجرة كبيرة في السنوات الأولى لاستقلال أوكرانيا. هاجر أكثر من مليون شخص إلى أوكرانيا في 1991-1992، معظمهم من الجمهوريات السوڤيتية السابقة الأخرى. بصفة إجمالية، بين عامي 1991 و2004، هاجر 2.2 مليون إلى أوكرانيا (من بينهم 2 مليون قدموا من دول الاتحاد السوڤيتي السابق الأخرى)، و2.5 مليون هاجروا من أوكرانيا (من بينهم، 1.9 مليونًا انتقلوا إلى جمهوريات الاتحاد السوڤيتي السابق الأخرى).[16] اعتبارًا من عام 2015، شكل المهاجرون ما يقدر بنحو 11.4% من إجمالي السكان، أو 4.8 مليون شخص.[17] عام 2006، كان هناك ما يقدر بـ 1.2 مليون كندي من أصل أوكراني،[18] مما يجعل الأوكرانيون-الكنديون في المرتبة الثالثة بعد الأوكرانيون والروس. هناك أيضًا جاليات كبيرة من المهاجرين الأوكرانيين في الولايات المتحدة وپولندا وأستراليا والبرازيل والأرجنتين.
منذ حوالي عام 2015 كان هناك عدد متزايد من الأوكرانيين العاملين في الاتحاد الأوروپي، ولا سيما پولندا. أفادت يوروستات أن 662.000 أوكراني حصلوا على تصاريح إقامة في الاتحاد الأوروپي في عام 2017، منهم 585.439 إلى پولندا. تُظهر إحصائيات البنك الدولي أن التحويلات المالية إلى أوكرانيا قد تضاعفت تقريبًا من عام 2015 حتى 2018، وتبلغ قيمتها حوالي 4% من الناتج المحلي الإجمالي.[19][20] ومع ذلك ، لا تُمثل هذه الهجرة في بيانات الهجرة الأوكرانية، والتي تقيس التسجيلات في دائرة الهجرة الحكومية والتي عادة ما يتم إجراؤها فقط من قبل الأوكرانيين الحاصلين على الجنسية الأجنبية. من غير الواضح ما إذا كان أولئك الذين ينتقلون للعمل في الاتحاد الأوروپي يعتزمون أن يكون ذلك مؤقتًا أم دائمًا.[21]
تراجع أعداد السكان
حسب تقديرات هيئة الإحصاءات الأوكرانية، فإن عدد سكان أوكرانيا في 1 مايو 2021 (باستثناء القرم) قبل بلغ 41.442.615 نسمة.[1]
انخفض عدد سكان البلاد منذ التسعينيات بسبب ارتفاع معدل الهجرة، إلى جانب ارتفاع معدلات الوفيات وانخفاض معدلات المواليد. يتقلص عدد السكان بمعدل يزيد عن 300.000 سنويًا منذ عام 1993.[بحاجة لمصدر]
في 2007، كان معدل انخفاض عدد السكان في البلاد رابع أعلى معدل في العالم.[24]
تعاني أوكرانيا من ارتفاع معدل الوفيات جراء التلوث البيئي، والنظام الغذائي السيئ، وانتشار التدخين، وإدمان الكحول على نطاق واسع، وتدهور الرعاية الطبية.[25][26]
في الفترة من عام 2008 حتى 2010، ولد أكثر من 1.5 مليون طفل في أوكرانيا، مقارنة بأقل من 1.2 مليون خلال الفترة 1999-2001. عام 2008 سجلت أوكرانيا معدلات مواليد قياسية منذ استقلالها عام 1991. كما انخفضت معدلات وفيات الرضع من 10.4 حالة وفاة إلى 8.3 لكل 1000 طفل دون سن عام واحد. هذا أقل مما هو عليه في 153 بلد في العالم.[27]
عام 2019، أجرت الحكومة تعدادًا إلكترونيًا باستخدام مصادر متعددة، بما في ذلك بيانات الهاتف المحمول والمعاشات التقاعدية، وقدرت أن عدد سكان أوكرانيا، باستثناء شبه جزيرة القرم وأجزاء من دونباس، سيكون 37.3 مليون. حوالي 20 مليون كانوا في سن العمل النشط.[7][28]
الخصوبة والسياسات الوطنية
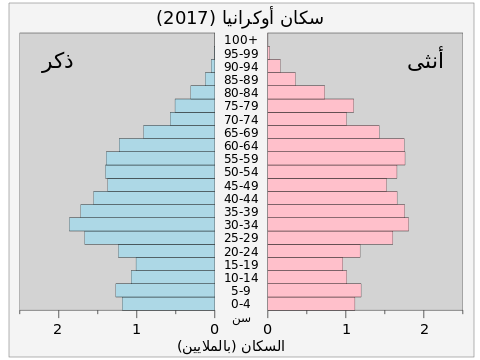
عام 2017.]]
اعتباراً من 2020، كان معدل المواليد في أوكرانيا هو 8.1 مولود حي/1000 نسمة، ومعدل الوفيات 14.7 متوفى/1000 نسمة.[2]
ظاهرة الخصوبة المنخفضة-الأكثر انخفاضاً، التي تُعرَّف على أنها الخصوبة الإجمالية أقل من 1.3، تظهر في جميع أنحاء أوروپا ويعزوها الكثيرون إلى تأجيل بدء الإنجاب. أوكرانيا، حيث كانت الخصوبة الإجمالية (منخفضة للغاية 1.1 عام 2001)، كانت واحدة من أدنى المعدلات في العالم، تظهر أن هناك أكثر من طريق واحد إلى أدنى معدلات الخصوبة المنخفضة. على الرغم من أن أوكرانيا خضعت لتحولات سياسية واقتصادية هائلة خلال الفترة 1991-2004، إلا أنها حافظت على سن مبكرة عند الولادة الأولى وحالات الإنجاب الشاملة تقريبًا. يُظهر تحليل الإحصاءات الوطنية الرسمية والمسح الأوكراني للصحة الإنجابية أن الخصوبة انخفضت إلى مستويات منخفضة للغاية دون الانتقال إلى نمط لاحق من الإنجاب. تقترح النتائج من المقابلات الجماعية المركزة تفسيرات لنمط الخصوبة المبكر. تشمل هذه النتائج استمرار المعايير التقليدية للحمل وأدوار الرجال والنساء، والمخاوف بشأن المضاعفات الطبية والعقم في سن متأخرة، والعلاقة بين الخصوبة المبكرة والزواج المبكر.[29] تمتعت أوكرانيا لاحقاً بأكبر عمر للسكان في العالم، حيث بلغ متوسط أعمار سكان أوكرانيا 40.8 سنة.[30]
للمساعدة في التخفيف من انخفاض عدد السكان، تواصل الحكومة زيادة مدفوعات إعالة الأطفال. وبالتالي، فإنها توفر مدفوعات لمرة واحدة قدرها 12،250 هريڤنيا للطفل الأول، و25000 هريڤنيا للطفل الثاني و50000 هريڤنيا للثالث والرابع، إلى جانب مدفوعات شهرية قدرها 154 هريڤنيا للطفل الأول.[31][32] يظهر التوجه الديموغرافي علامات التحسن، حيث أن معدل المواليد ينمو باطراد منذ عام 2001.[33] تم تسجيل النمو السكاني الصافي خلال الأشهر التسعة الأولى من عام 2007 في خمس مقاطعات من البلاد (من أصل 24)، وكان الانكماش السكاني يظهر علامات الاستقرار على الصعيد الوطني. عام 2007 كانت أعلى معدلات المواليد في الأوبلاستات الغربية.[34]
عام 2008، خرجت أوكرانيا من معدلات الخصوبة الدنيا، واستمر الاتجاه التصاعدي حتى عام 2012، بينما كان عدد السكان لا يزال يتناقص ولكن بوتيرة تتباطأ عامًا بعد عام. إذا استمرت اتجاهات أوائل عام 2010، كان من الممكن أن يعود سكان أوكرانيا إلى النمو الإيجابي في وقت لاحق من نفس العقد. شوهدت اتجاهات مماثلة في روسيا وبلاروسيا أيضًا، والتي شهدت نموًا سكانيًا في عام 2010. عام 2014، عاد التراجع الكبير في المواليد، حيث كان عام 2018 أقل من نصف عدد المواليد كما في عام 1989. (انظر الجداول الديموغرافية) في عام 2020 انخفض عدد المواليد إلى 293000، وصلت إلى مستويات لم تشهدها أوكرانيا حتى في أواخر التسعينيات وأوائل القرن الحادي والعشرين عندما بدأ عدد المواليد في الزيادة.
وفقًا لمقابلة أجريت 2021 مع الأستاذة الأوكرانية إيرينا كوريلو[35] من معهد م.ڤ. پتوخا للديموغرافيا والدراسات الاجتماعية، فإن معدل الخصوبة الإجمالي في أوكراينا هو 1.20 طفل لكل امرأة مما يجعله الأدنى في أوروپا.[36]
إحصائيات حيوية
المحافظات الأوكرانية في الامبراطورية الروسية
تشير الأرقام أدناه إلى المحافظات التسع في الإمبراطورية الروسية (ڤولهينيا، يكاترينوسلاڤ، كييڤ، پودوليا ، ڤولتاڤا، توريدا، خاركوڤ، خرسون وتشيرنيهيڤ) ذات الأغلبية الأوكرانية.[37]
| متوسط السكان | المواليد الأحياء | الوفيات | التغير الطبيعي | Crude معدل المواليد (لكل 1.000) | معدل الوفيات الصافي (لكل 1.000) | التغير الطبيعي (لكل 1.000) | معدلات الخصوبة الإجمالية | |
|---|---|---|---|---|---|---|---|---|
| 1900 | 24.969.000 | 1.203.334 | 660.723 | 542.611 | 48.2 | 26.5 | 21.7 | |
| 1901 | 25.505.000 | 1.123.519 | 657.883 | 465.636 | 44.1 | 25.8 | 18.3 | |
| 1902 | 25.935.000 | 1.207.512 | 681.580 | 525.932 | 46.6 | 26.3 | 20.3 | |
| 1903 | 26.449.000 | 1.188.404 | 663.067 | 525.337 | 44.9 | 25.1 | 19.9 | |
| 1904 | 26.961.000 | 1.228.116 | 682.068 | 546.048 | 45.6 | 25.3 | 20.3 | |
| 1905 | 27.210.000 | 1.160.308 | 779.107 | 381.201 | 41.1 | 27.6 | 14.0 | |
| 1906 | 27.949.000 | 1.225.951 | 724.045 | 501.906 | 43.9 | 25.9 | 18.0 | |
| 1907 | 28.418.000 | 1.279.027 | 701.451 | 577.576 | 45.0 | 24.7 | 20.3 | |
| 1908 | 29.069.000 | 1.232.862 | 692.624 | 540.238 | 42.4 | 23.8 | 18.6 | |
| 1909 | 29.700.000 | 1.226.155 | 744.818 | 481.337 | 41.3 | 25.1 | 16.2 | |
| 1910 | 30.297.000 | 1.225.658 | 839.491 | 386.167 | 40.5 | 27.7 | 12.7 | |
| 1911 | 30.858.000 | 1.240.985 | 670.742 | 570.243 | 40.2 | 21.7 | 18.5 | |
| 1912 | 30.580.000 | 1.245.358 | 654.157 | 591.201 | 40.7 | 21.4 | 19.3 | |
| 1913 | 31.142.000 | 1,222,277 | 715.924 | 506.353 | 39.2 | 23.0 | 16.3 | 6.00 |
| 1914 | 30,973.000 | 1.240.114 | 716.875 | 523.239 | 40.0 | 23.1 | 16.9 |
ما بين الحربين العالميتين[38]
| متوسط السكان | المواليد الأحياء | الوفيات | التغير الطبيعي | معدل المواليد الصافي (لكل 1.000) | معدل الوفيات الصافي (لكل 1.000) | التغير الطبيعي (لكل 1.000) | معدلات الخصوبة | العمر المتوقع (الذكور) | العمر المتوقع (الإناث) | |
|---|---|---|---|---|---|---|---|---|---|---|
| 1924 | 27.400.000 | 1.211.000 | 484.880 | 726.120 | 43.3 | 17.3 | 25.9 | |||
| 1925 | 28,000,000 | 1,246,000 | 531,819 | 714,181 | 43.4 | 18.5 | 24.9 | 5.39 | ||
| 1926 | 28,700,000 | 1,258,000 | 518,656 | 739,344 | 42.5 | 17.5 | 25.0 | |||
| 1927 | 29,589,000 | 1,228,000 | 579,000 | 649,000 | 40.6 | 19.1 | 21.5 | 43.3 | 46.8 | |
| 1928 | 30,251,000 | 1,178,000 | 575,000 | 603,000 | 38.1 | 18.6 | 19.5 | 44.6 | 48.7 | |
| 1929 | 30,894,000 | 1,115,000 | 585,000 | 530,000 | 35.5 | 18.6 | 16.9 | 42.8 | 46.7 | |
| 1930 | 31,436,000 | 1,053,000 | 580,000 | 473,000 | 33.0 | 18.2 | 14.8 | 42.5 | 46.9 | |
| 1931 | 31,882,000 | 1,001,000 | 553,000 | 448,000 | 31.0 | 17.1 | 13.9 | 43.5 | 47.9 | |
| 1932 | 32,342,000 | 801,000 | 746,000 | 55,000 | 24.7 | 23.0 | 1.7 | 34.5 | 39.4 | |
| 1933 | 32,456,000 | 576,000 | 2,583,000 | -2,007,000 | 18.6 | 83.5 | -64.9 | 7.3 | 10.9 | |
| 1934 | 30,916,000 | 562,000 | 508,000 | 54,000 | 18.1 | 16.4 | 1.7 | 37.6 | 42.1 | |
| 1935 | 31,006,000 | 770,000 | 381,000 | 389,000 | 24.5 | 12.1 | 12.4 | 46.3 | 52.7 | |
| 1936 | 31,423,000 | 905,000 | 403,000 | 502,000 | 28.3 | 12.6 | 15.7 | 47.6 | 53.0 | |
| 1937 | 31,957,000 | 1,227,000 | 450,000 | 777,000 | 37.5 | 13.7 | 23.7 | 46.2 | 51.9 | |
| 1938 | 32,742,000 | 1,123,000 | 451,000 | 672,000 | 33.6 | 13.5 | 20.1 | 47.9 | 52.7 | |
| 1939 | 33,425,000 | 1,080,000 | 412,600 | 667,400 | 31.7 | 12.1 | 19.6 | 47.7 | 52.5 | |
| 1940(b) | 40,649,000 | 1,243,000 | 30.6 | 3.80 | 47.4 | 52.4 |
(a) المعلومات المقدمة عن أراضي أوكرانيا داخل حدودها القديمة حتى 17 سبتمبر 1939.
(b) معلومات المقدمة عن أراضي أوكرانيا داخل حدودها الحالية، بعد الضم السوڤيتيتي لگاليسيا الشرقية وڤولينيا في سبتمبر 1939
. . . . . . . . . . . . . . . . . . . . . . . . . . . . . . . . . . . . . . . . . . . . . . . . . . . . . . . . . . . . . . . . . . . . . . . . . . . . . . . . . . . . . . . . . . . . . . . . . . . . . . . . . . . . . . . . . . . . . . . . . . . . . . . . . . . . . . . . . . . . . . . . . . . . . . . . . . . . . . . . . . . . . . . .
بعد الحرب العالمية الثانية
المصدر: دائرة الإحصاءات الحكومية الأوكرانية[39]
| متوسط السكان |
المواليد الأحياء | الوفيات | التغير الطبيعي | معدل المواليد الصافي (لكل 1.000) | معدل الوفيات الصافي (لكل 1.000) | التغير الطبيعي (لكل 1.000) | معدلات الخصوبة | الخصوبة في الحضر | الخصوبة في الريف | حالات الإجهاض (المبلغة) | |
|---|---|---|---|---|---|---|---|---|---|---|---|
| 1945 | 435,230 | ||||||||||
| 1946 | 753,493 | ||||||||||
| 1947 | 712,994 | ||||||||||
| 1948 | 757,783 | ||||||||||
| 1949 | 911,641 | ||||||||||
| 1950 | 36,905,000 | 844,585 | 315,300 | 529,300 | 22.9 | 8.5 | 14.3 | 2.81 | |||
| 1951 | 37,569,000 | 858,052 | 327,500 | 530,600 | 22.8 | 8.7 | 14.1 | 2.76 | |||
| 1952 | 38,141,000 | 846,434 | 325,700 | 520,700 | 22.2 | 8.5 | 13.7 | 2.64 | |||
| 1953 | 38,678,000 | 795,652 | 326,800 | 468,900 | 20.6 | 8.4 | 12.1 | 2.41 | |||
| 1954 | 39,131,000 | 845,128 | 318,500 | 526,600 | 21.6 | 8.1 | 13.5 | 2.48 | |||
| 1955 | 39,506,000 | 792,696 | 296,200 | 496,500 | 20.1 | 7.5 | 12.6 | 2.70 | |||
| 1956 | 40,082,000 | 822,569 | 293,000 | 529,600 | 20.5 | 7.3 | 13.2 | 2.29 | |||
| 1957 | 40,800,000 | 847,781 | 304,800 | 543,000 | 20.8 | 7.5 | 13.3 | 2.29 | |||
| 1958 | 41,512,000 | 873,483 | 286,700 | 586,800 | 21.0 | 6.9 | 14.1 | 2.30 | |||
| 1959 | 42,155,000 | 880,552 | 316,800 | 563,800 | 20.9 | 7.5 | 13.4 | 2.29 | |||
| 1960 | 42,469,000 | 878,768 | 296,171 | 582,597 | 20.7 | 7.0 | 13.7 | 2.24 | |||
| 1961 | 43,097,000 | 843,482 | 304,346 | 539,136 | 19.6 | 7.1 | 12.5 | 2.17 | |||
| 1962 | 43,559,000 | 823,151 | 331,454 | 491,697 | 18.9 | 7.6 | 11.3 | 2.14 | |||
| 1963 | 44,088,000 | 794,969 | 323,556 | 471,413 | 17.9 | 7.3 | 10.6 | 2.06 | |||
| 1964 | 44,664,000 | 741,668 | 315,340 | 426,328 | 16.5 | 7.0 | 9.5 | 1.96 | |||
| 1965 | 45,133,000 | 692,153 | 342,717 | 349,436 | 15.3 | 7.6 | 7.7 | 1.99 | |||
| 1966 | 45,548,000 | 713,492 | 344,850 | 368,642 | 15.6 | 7.5 | 8.1 | 2.02 | |||
| 1967 | 45,997,000 | 699,381 | 368,573 | 330,808 | 15.1 | 8.0 | 7.2 | 2.01 | |||
| 1968 | 46,408,000 | 693,064 | 374,440 | 318,624 | 14.9 | 8.0 | 6.9 | 1.99 | |||
| 1969 | 46,778,000 | 687,991 | 404,151 | 283,840 | 14.7 | 8.6 | 6.1 | 2.04 | |||
| 1970 | 47,127,000 | 719,213 | 418,679 | 300,534 | 15.2 | 8.9 | 6.4 | 2.10 | 1,130,315 | ||
| 1971 | 47,507,000 | 736,691 | 424,717 | 311,974 | 15.4 | 8.9 | 6.6 | 2.12 | |||
| 1972 | 47,903,000 | 745,696 | 443,038 | 302,658 | 15.5 | 9.2 | 6.3 | 2.08 | |||
| 1973 | 48,274,000 | 719,560 | 449,351 | 270,209 | 14.9 | 9.3 | 5.6 | 2.04 | |||
| 1974 | 48,571,000 | 736,616 | 455,970 | 280,646 | 15.1 | 9.4 | 5.8 | 2.04 | |||
| 1975 | 48,881,000 | 738,857 | 489,550 | 249,307 | 15.1 | 10.0 | 5.1 | 2.02 | 1,110,223 | ||
| 1976 | 49,151,000 | 747,069 | 500,584 | 246,485 | 15.2 | 10.2 | 5.0 | 1.99 | |||
| 1977 | 49,388,000 | 726,217 | 517,967 | 208,250 | 14.7 | 10.5 | 4.2 | 1.94 | |||
| 1978 | 49,578,000 | 732,187 | 529,681 | 202,506 | 14.7 | 10.7 | 4.1 | 1.96 | |||
| 1979 | 49,755,000 | 735,188 | 552,019 | 183,169 | 14.7 | 11.1 | 3.7 | 1.96 | |||
| 1980 | 50,044,000 | 742,489 | 568,243 | 174,246 | 14.8 | 11.4 | 3.5 | 1.95 | 1,197,000 | ||
| 1981 | 50,222,000 | 733,183 | 568,789 | 164,394 | 14.6 | 11.3 | 3.3 | 1.93 | 1,112,734 | ||
| 1982 | 50,388,000 | 745,591 | 568,231 | 177,360 | 14.8 | 11.3 | 3.5 | 1.94 | 1,131,437 | ||
| 1983 | 50,573,000 | 807,111 | 583,496 | 223,615 | 16.0 | 11.6 | 4.4 | 2.11 | 1,125,686 | ||
| 1984 | 50,768,000 | 792,035 | 610,338 | 181,697 | 15.6 | 12.0 | 3.6 | 2.08 | 1,127,627 | ||
| 1985 | 50,941,000 | 762,775 | 617,548 | 145,227 | 15.0 | 12.1 | 2.9 | 2.02 | 1,179,000 | ||
| 1986 | 51,143,000 | 792,574 | 565,150 | 227,424 | 15.5 | 11.1 | 4.4 | 2.13 | 1,166,039 | ||
| 1987 | 51,373,000 | 760,851 | 586,387 | 174,464 | 14.8 | 11.4 | 3.4 | 2.07 | 1,168,136 | ||
| 1988 | 51,593,000 | 744,056 | 600,725 | 143,331 | 14.4 | 11.6 | 2.8 | 2.04 | 1,080,029 | ||
| 1989 | 51,770,000 | 690,981 | 600,590 | 90,391 | 13.3 | 11.6 | 1.7 | 1.92 | 1.78 | 2.33 | 1,058,414 |
| 1990 | 51,838,500 | 657,202 | 629,602 | 27,600 | 12.7 | 12.1 | 0.5 | 1.84 | 1.69 | 2.27 | 1,019,038 |
| 1991 | 51,944,400 | 630,813 | 669,960 | -39,147 | 12.1 | 12.9 | -0.8 | 1.78 | 1.60 | 2.29 | 957,022 |
| 1992 | 52,056,600 | 596,785 | 697,110 | -100,325 | 11.4 | 13.4 | -1.9 | 1.67 | 1.48 | 2.23 | 932,272 |
| 1993 | 52,244,100 | 557,467 | 741,662 | -184,195 | 10.7 | 14.2 | -3.5 | 1.56 | 1.37 | 2.08 | 860,996 |
| 1994 | 52,114,400 | 521,545 | 764,669 | -243,124 | 10.0 | 14.7 | -4.7 | 1.47 | 1.28 | 1.98 | 798,538 |
| 1995 | 51,728,400 | 492,861 | 792,587 | -299,726 | 9.6 | 15.4 | -5.8 | 1.40 | 1.21 | 1.88 | 740,172 |
| 1996 | 51,297,100 | 467,211 | 776,717 | -309,506 | 9.2 | 15.2 | -6.0 | 1.34 | 1.16 | 1.79 | 687,035 |
| 1997 | 50,818,400 | 442,581 | 754,151 | -311,570 | 8.7 | 14.9 | -6.1 | 1.27 | 1.10 | 1.70 | 596,740 |
| 1998 | 50,370,800 | 419,238 | 719,954 | -300,716 | 8.4 | 14.4 | -6.0 | 1.21 | 1.05 | 1.64 | 525,329 |
| 1999 | 49,918,100 | 389,208 | 739,170 | -349,962 | 7.8 | 14.9 | -7.0 | 1.13 | 0.97 | 1.53 | 495,760 |
| 2000 | 49,429,800 | 385,126 | 758,082 | -372,956 | 7.8 | 15.4 | -7.6 | 1.12 | 0.97 | 1.51 | 434,223 |
| 2001 | 48,923,200 | 376,478 | 745,952 | -369,474 | 7.7 | 15.3 | -7.6 | 1.08 | 0.95 | 1.41 | 369,750 |
| 2002 | 48,457,102 | 390,688 | 754,911 | -364,223 | 8.1 | 15.7 | -7.6 | 1.10 | 0.97 | 1.43 | 345,967 |
| 2003 | 48,003,463 | 408,589 | 765,408 | -356,819 | 8.5 | 16.0 | -7.4 | 1.17 | 1.07 | 1.45 | 315,835 |
| 2004 | 47,622,434 | 427,259 | 761,261 | -334,002 | 9.0 | 16.0 | -7.0 | 1.22 | 1.13 | 1.46 | 289,065 |
| 2005 | 47,280,817 | 426,086 | 781,961 | -355,875 | 9.0 | 16.6 | -7.5 | 1.21 | 1.12 | 1.46 | 263,950 |
| 2006 | 46,929,525 | 460,368 | 758,092 | -297,724 | 9.8 | 16.2 | -6.3 | 1.31 | 1.21 | 1.59 | 229,618 |
| 2007 | 46,646,046 | 472,657 | 762,877 | -290,220 | 10.2 | 16.4 | -6.2 | 1.35 | 1.24 | 1.63 | 210,454 |
| 2008 | 46,372,664 | 510,589 | 754,460 | -243,871 | 11.0 | 16.3 | -5.3 | 1.46 | 1.35 | 1.75 | 217,413 |
| 2009 | 46,143,714 | 512,525 | 706,739 | -194,214 | 11.1 | 15.3 | -4.2 | 1.47 | 1.35 | 1.78 | 194,845 |
| 2010 | 45,962,947 | 497,689 | 698,235 | -200,546 | 10.8 | 15.2 | -4.4 | 1.44 | 1.31 | 1.77 | 176,774 |
| 2011 | 45,778,534 | 502,595 | 664,588 | -161,993 | 11.0 | 14.5 | -3.5 | 1.46 | 1.32 | 1.80 | 169,131 |
| 2012 | 45,633,637 | 520,705 | 663,139 | -142,434 | 11.4 | 14.5 | -3.1 | 1.53 | 1.39 | 1.87 | 153,147 |
| 2013 | 45,553,047 | 503,657 | 662,368 | -158,711 | 11.1 | 14.6 | -3.5 | 1.51 | 1.37 | 1.83 | 147,736 |
| 2014 | 45,426,249 | 465,882 | 632,296 | -166,414 | 10.8 | 14.7 | -3.7 | 1.50 | 1.35 | 1.83 | 116,104 |
| 2015 | 42,929,298 | 411,781 | 594,796 | -183,015 | 10.7 | 14.9 | -4.2 | 1.51 | 1.39 | 1.71 | 106,357 |
| 2016 | 42,760,516 | 397,037 | 583,631 | -186,594 | 10.3 | 14.7 | -4.4 | 1.47 | 1.36 | 1.64 | 101,121 |
| 2017 | 42,584,542 | 363,987 | 574,123 | -210,136 | 9.4 | 14.5 | -5.1 | 1.37 | 1.28 | 1.52 | 94,665 |
| 2018 | 42,386,403 | 335,874 | 587,665 | -251,791 | 8.7 | 14.8 | -6.1 | 1.30 | 1.22 | 1.43 | 46,552 |
| 2019 | 42,153,201 | 308,817 | 581,114 | -272,297 | 8.1 | 14.7 | -6.6 | 1.23 | 1.16 | 1.34 | 74,606 |
| 2020 | 41,902,416 | 293,457 | 616,835 | -323,378 | 7.8 | 15.9 | -8.1 | 1.22 | 1.13 | 1.36 | |
| 2021 | 41,167,336 | 271,984 | 714,263 | -442,279 | 6.7 | 17.3 | -10.6 |
| المواليد الأحياء بالحضر | الوفيات بالحضر | التغير الطبيعي بالحضر | معدل المواليد الصافي بالحضر (لكل 1.000) | معدل الوفيات الصافي بالحضر (لكل 1.000) | التغير الطبيعي بالحضر (لكل 1.000) | المواليد الاحياء بالريف | الوفيات بالريف | التغير الطبيعي بالريف | معدل المواليد الصافي بالريف (لكل 1.000) | معدل الوفيات الصافي بالريف (لكل 1.000) | التغير الطبيعي بالريف (لكل 1.000) | |
|---|---|---|---|---|---|---|---|---|---|---|---|---|
| 1990 | 442,869 | 357,114 | 85,755 | 12.7 | 10.2 | 2.5 | 214,333 | 272,488 | -58,155 | 12.7 | 16.1 | -3.4 |
| 1991 | 419,205 | 380,988 | 38,217 | 11.9 | 10.8 | 1.1 | 211,608 | 288,972 | -77,364 | 12.6 | 17.2 | -4.6 |
| 1992 | 387,696 | 401,849 | -14,153 | 11.0 | 11.4 | -0.4 | 209,089 | 295,261 | -86,172 | 12.5 | 17.6 | -5.1 |
| 1993 | 356,833 | 432,462 | -75,629 | 10.1 | 12.2 | -2.1 | 200,634 | 309,200 | -108,566 | 12.0 | 18.5 | -6.5 |
| 1994 | 328,522 | 450,823 | -122,301 | 9.3 | 12.8 | -3.5 | 193,023 | 313,846 | -120,823 | 11.6 | 18.8 | -7.2 |
| 1995 | 308,408 | 476,434 | -168,026 | 8.8 | 13.6 | -4.8 | 184,453 | 316,153 | -131,700 | 11.1 | 19.1 | -8.0 |
| 1996 | 291,121 | 460,805 | -169,684 | 8.4 | 13.3 | -4.9 | 176,090 | 315,912 | -139,822 | 10.7 | 19.2 | -8.5 |
| 1997 | 274,961 | 444,446 | -169,485 | 8.0 | 13.0 | -5.0 | 167,620 | 309,705 | -142,085 | 10.2 | 18.9 | -8.7 |
| 1998 | 258,724 | 425,521 | -166,797 | 7.6 | 12.6 | -5.0 | 160,514 | 294,433 | -133,919 | 9.9 | 18.1 | -8.2 |
| 1999 | 239,408 | 439,986 | -200,578 | 7.1 | 13.1 | -6.0 | 149,800 | 299,184 | -149,384 | 9.3 | 18.5 | -9.2 |
| 2000 | 238,014 | 457,069 | -219,055 | 7.2 | 13.8 | -6.6 | 147,112 | 301,013 | -153,901 | 9.2 | 18.8 | -9.6 |
| 2001 | 237,228 | 450,329 | -213,101 | 7.2 | 13.8 | -6.6 | 139,250 | 295,623 | -156,373 | 8.7 | 18.6 | -9.9 |
| 2002 | 248,877 | 454,406 | -205,529 | 7.7 | 14.0 | -6.3 | 141,811 | 300,505 | -158,694 | 9.0 | 19.1 | -10.1 |
| 2003 | 266,415 | 459,965 | -193,550 | 8.3 | 14.3 | -6.0 | 142,174 | 305,443 | -163,269 | 9.1 | 19.6 | -10.5 |
| 2004 | 284,361 | 460,492 | -176,131 | 8.9 | 14.4 | -5.5 | 142,898 | 300,769 | -157,871 | 9.3 | 19.6 | -10.3 |
| 2005 | 284,257 | 471,561 | -187,304 | 8.9 | 14.8 | -5.9 | 141,829 | 310,400 | -168,571 | 9.4 | 20.5 | -11.1 |
| 2006 | 306,635 | 461,774 | -155,139 | 9.6 | 14.5 | -4.9 | 153,733 | 296,318 | -142,585 | 10.3 | 19.8 | -9.5 |
| 2007 | 314,065 | 466,253 | -152,188 | 9.9 | 14.7 | -4.8 | 158,592 | 296,624 | -138,032 | 10.7 | 20.1 | -9.4 |
| 2008 | 340,594 | 462,897 | -122,303 | 10.8 | 14.6 | -3.8 | 169,995 | 291,563 | -121,568 | 11.6 | 19.9 | -8.3 |
| 2009 | 339,497 | 432,294 | -92,797 | 10.8 | 13.7 | -2.9 | 173,028 | 274,445 | -101,417 | 11.9 | 18.9 | -7.0 |
| 2010 | 326,587 | 431,130 | -104,543 | 10.4 | 13.7 | -3.3 | 171,102 | 267,105 | -96,003 | 11.9 | 18.6 | -6.7 |
| 2011 | 328,934 | 411,025 | -82,091 | 10.5 | 13.1 | -2.6 | 173,661 | 253,563 | -79,902 | 12.1 | 17.7 | -5.6 |
| 2012 | 341,599 | 411,787 | -70,188 | 10.9 | 13.1 | -2.2 | 179,106 | 251,352 | -72,246 | 12.6 | 17.7 | -5.1 |
| 2013 | 330,284 | 412,553 | -82,269 | 10.5 | 13.2 | -2.7 | 173,373 | 249,815 | -76,442 | 12.3 | 17.7 | -5.4 |
| 2014 | 304,190 | 391,739 | -87,549 | 10.2 | 13.2 | -3.0 | 161,692 | 240,557 | -78,865 | 12.2 | 18.1 | -5.9 |
| 2015 | 266,082 | 358,749 | -92,667 | 10.4 | 13.2 | -2.8 | 145,699 | 236,047 | -90,348 | 11.3 | 18.0 | -6.7 |
| 2016 | 258,688 | 354,634 | -95,946 | 10.0 | 13.2 | -3.2 | 138,349 | 228,997 | -90,648 | 10.8 | 17.6 | -6.8 |
| 2017 | 237,874 | 350,549 | -112,675 | 9.2 | 13.0 | -3.8 | 126,113 | 223,574 | -97,461 | 9.9 | 17.3 | -7.4 |
| 2018 | 220,102 | 363,732 | -143,630 | 8.5 | 13.4 | -4.9 | 115,772 | 223,933 | -108,161 | 9.2 | 17.5 | -8.3 |
| 2019 | 202,646 | 362,660 | -160,014 | 7.9 | 13.4 | -5.5 | 106,171 | 218,454 | -112,283 | 8.5 | 17.2 | -8.7 |
ملاحظة: البيانات باستثناء القرم بدءاً من 2014.[40]
. . . . . . . . . . . . . . . . . . . . . . . . . . . . . . . . . . . . . . . . . . . . . . . . . . . . . . . . . . . . . . . . . . . . . . . . . . . . . . . . . . . . . . . . . . . . . . . . . . . . . . . . . . . . . . . . . . . . . . . . . . . . . . . . . . . . . . . . . . . . . . . . . . . . . . . . . . . . . . . . . . . . . . . .
الإحصائيات الحيوية الحالية
| الفترة | المواليد الأحياء | الوفيات | الزيادة الطبيعية |
|---|---|---|---|
| يناير - نوفمبر 2020 | 268,899 | 549,172 | –280,273 |
| يناير - نوفمبر 2021 | 250,876 | 649,999 | –399,123 |
| الفرق | ▲ +100,827 (+18.36%) |
ملاحظة: اعتبارًا من عام 2014، لم يتم تضمين أراضي جمهورية القرم الذاتية ومدينة سيڤاستوپول وجزء من منطقة عمليات مكافحة الإرهاب في ديموغرافيا أوكرانيا. ضُمنت هذه الأراضي في ديموغرافيا روسيا. جميع البيانات من دائرة الإحصاء الحكومية في أوكرانيا.
العمر المتوقع عند الميلاد
- إجمالي السكان: 71.37 ▲ سنة
- الذكور: 66.34 ▲ سنة
- الإناث: 76.22 ▲ سنة (رسمياً 2013)
متوسط العمر المتوقع في عمر 0 لإجمالي السكان.[44]
| الفترة | العمر المتوقع بالسنوات |
|---|---|
| 1950–1955 | 61.83 |
| 1955–1960 | ▲ 67.11 |
| 1960–1965 | ▲ 69.69 |
| 1965–1970 | ▲ 70.66 |
| 1970–1975 | |
| 1975–1980 | |
| 1980–1985 | |
| 1985–1990 | ▲ 70.55 |
| 1990–1995 | |
| 1995–2000 | |
| 2000–2005 | ▲ 67.46 |
| 2005–2010 | ▲ 67.89 |
| 2010–2015 | ▲ 71.12 |
معدل الخصوبة الإجمالي
- 6.00
 طفل مولود/امرأة (تقديرات 1913)
 - 5.39
 طفل مولد/امرأة (تقديرات 1925)
 - 1.08
 طفل مولود/امرأة (2001)
 - 1.46 ▲ طفل مولود/امرأة (2011)
- 1.53 ▲ طفل مولود/امرأة (2012)
- 1.21
 طفل مولود/امرأة (2018)
في 2001 سجلت أوكرانيا أدنى معدل خصوبة تم تسجيله على الإطلاق في أوروپا لدولة مستقلة: 1.08 طفل/امرأة. خلال هذا العام كان عدد الأطفال المولودين أقل من نصف عدد المواليد عام 1987 وأقل من ربع عدد المواليد عام 1937. وسجلت المعدلات الأدنى فقط في ألمانيا الشرقية السابقة، التي سجلت 0.77 طفل/امرأة عام 1994، وكذلك تايوان (من 2008 حتى 2010)، وكوريا الجنوبية عام 2018 وكل من هونگ كونگ ومكاو (من حوالي 2000 حتى 2010). بعد إهمال إدارة كوتشما، جعلت حكومتا يوشينكو ويانوكوڤيتش زيادة أولية في معدل المواليد.
إحصائيات ديموغرافية
السكان حسب الأوبلاست
| اسم الأوبلاست | السكان اعتباراً من ديسمبر 2021 |
|---|---|
| 4.062.839 | |
| 3.100.320 | |
| 2.952.577 | |
| 2.602.207 | |
| 2.480.137 | |
| 2.352.648 | |
| 2.104.531 | |
| 1.795.099 | |
| 1.640.876 | |
| 1.511.574 | |
| 1.354.444 | |
| 1.352.973 | |
| 1.245.491 | |
| 1.230.507 | |
| 1.180.638 | |
| 1.162.439 | |
| 1.142.599 | |
| 1.093.492 | |
| 1.037.237 | |
| 1.022.625 | |
| 1.022.107 | |
| 1.002.923 | |
| 961.054 | |
| 905.715 | |
| 891.054 | |
| 41.208.106 |
بيانات المواليد حسب الأوبلاست
ملحوظة: البيانات الأخيرة لأوبلاستي دونيتسك ولوهانسك تأثرت بالحرب في دونباس، وقد تشمل فقط المواليد داخل الأجزاء التي تسيطر عليها الحكومة الاوكرانية من الأوبلاستات.[45]
| عدد المواليد حسب الأوبلاست يناير-نوفمبر | المواليد/2016 | المواليد/2015 | الوفيات/2016 | الوفيات/2015 |
|---|---|---|---|---|
| 33416 ▲ | 32382 ▲ | 27772 ▲ | 27767 ▲ | |
| 28473 |
30620 |
47934 ▼ | 49258 ▲ | |
| 25708 ▲ | 25007 |
29247 ▼ | 30010 ▲ | |
| 24246 |
25182 |
30479 ▼ | 31512 ▲ | |
| 21992 |
22864 |
38502 ▼ | 38965 ▲ | |
| 17772 ▲ | 15608 |
33464 ▼ | 36883 ▼ | |
| 17559 |
18485 |
25623 ▼ | 26046 ▲ | |
| 14862 |
15525 |
13880 ▼ | 14164 ▲ | |
| 14454 |
14809 |
13261 ▼ | 13426 ▲ | |
| 14430 |
15140 |
25533 ▼ | 25657 ▲ | |
| 14153 |
15126 |
22521 ▼ | 23237 ▼ | |
| 13547 |
14412 |
15616 ▼ | 16144 ▲ | |
| 12047 |
12307 |
12311 ▼ | 12602 ▲ | |
| 11958 |
12526 |
18301 ▼ | 19085 ▼ | |
| 11793 |
12768 |
18097 ▼ | 18702 ▲ | |
| 11503 |
12381 |
22084 ▼ | 22440 ▼ | |
| 9904 |
10626 |
15834 ▼ | 16316 ▲ | |
| 9877 |
10476 |
14891 ▼ | 15055 ▲ | |
| 9721 |
10560 |
18437 ▲ | 18315 ▼ | |
| 9461 |
9851 |
10399 ▼ | 10738 ▲ | |
| 9177 |
9912 |
13584 ▼ | 13962 ▲ | |
| 8189 |
8662 |
14810 ▲ | 14809 ▼ | |
| 8169 |
8959 |
16982 ▼ | 17322 ▼ | |
| 7816 |
8359 |
17515 ▼ | 18199 ▼ | |
| 5960 ▲ | 4978 |
12689 ▼ | 13401 ▼ |
| عدد المواليد حسب الأوبلاست | المواليد/2014 | المواليد/2013 | المواليد/2012 | المواليد/2011 | الوفيات/2014 | الوفيات/2013 | الوفيات/2012 | الوفيات/2011 |
|---|---|---|---|---|---|---|---|---|
| 36497 ▲ | 36134 |
37087 ▲ | 36116 ▲ | 52722 ▲ | 51134 ▼ | 51486 ▼ | 52106 ▼ | |
| 35595 |
41034 |
42839 ▲ | 41720 ▲ | 71799 ▲ | 69345 ▼ | 70496 ▼ | 71042 ▼ | |
| 34821 ▲ | 33305 |
33887 ▲ | 32068 |
29992 ▲ | 28003 ▲ | 27840 ▲ | 27050 ▼ | |
| 30270 ▲ | 29542 |
30220 ▲ | 28904 ▲ | 32450 ▲ | 31666 ▼ | 31667 ▲ | 31162 ▼ | |
| 29465 ▲ | 29075 |
30384 ▲ | 29225 ▲ | 34155 ▲ | 33523 ▼ | 33648 ▼ | 33688 ▼ | |
| 27690 ▲ | 26700 |
27244 ▲ | 26317 ▲ | 41891 ▲ | 39465 ▼ | 40130 ▲ | 40079 ▼ | |
| 20900 ▲ | 20511 |
20966 ▲ | 20083 ▲ | 28264 ▲ | 27198 ▲ | 27161 ▲ | 26847 ▼ | |
| 18713 ▲ | 18134 |
18882 ▲ | 18198 ▲ | 27773 ▲ | 26498 ▲ | 26406 ▼ | 27033 ▼ | |
| 18377 |
18490 |
18968 ▲ | 18460 ▲ | 14808 ▲ | 14801 ▼ | 14813 ▲ | 14588 ▼ | |
| 17547 ▲ | 17437 |
18339 ▲ | 17894 ▲ | 25567 ▲ | 25453 ▲ | 25158 ▼ | 25376 ▼ | |
| 17169 |
17445 |
18316 ▲ | 17697 ▲ | 14714 ▲ | 14556 ▲ | 14302 ▲ | 14168 ▼ | |
| 16886 ▲ | 16716 |
17101 ▲ | 16497 ▲ | 17670 ▲ | 17358 ▲ | 16801 ▲ | 16657 ▼ | |
| 15115 ▲ | 15001 |
15486 ▲ | 15154 ▲ | 21185 ▲ | 20859 ▲ | 20685 ▲ | 20417 ▼ | |
| 14668 |
14700 |
15346 ▲ | 14620 |
13748 ▲ | 13666 ▼ | 13710 ▼ | 13842 ▼ | |
| 14631 ▲ | 14548 |
14881 ▲ | 14492 ▲ | 20408 ▼ | 20581 ▲ | 20362 ▲ | 20116 ▼ | |
| 14504 ▲ | 14296 |
14635 ▲ | 14167 |
24784 ▲ | 24358 ▲ | 24223 ▼ | 24384 ▼ | |
| 13076 ▲ | 13043 |
13515 ▲ | 13029 ▲ | 17750 ▲ | 17353 ▲ | 17277 ▼ | 17441 ▼ | |
| 12351 ▲ | 12100 |
12798 ▲ | 12473 ▲ | 20800 ▲ | 20477 ▼ | 20667 ▼ | 20848 ▼ | |
| 12308 ▲ | 12300 |
12643 ▲ | 12085 |
16141 ▲ | 16048 ▲ | 15904 ▲ | 15828 ▼ | |
| 11717 |
11807 |
12202 ▲ | 11964 ▲ | 15180 ▲ | 14682 ▼ | 14838 ▲ | 14829 ▼ | |
| 11679 ▲ | 11465 |
11592 ▲ | 11281 ▲ | 11619 ▲ | 11520 ▲ | 11321 ▼ | 11192 ▼ | |
| 11442 |
20531 |
21743 ▲ | 21320 ▲ | 22755 ▼ | 35822 ▼ | 36316 ▼ | 37256 ▼ | |
| 10576 ▲ | 10562 |
11029 ▲ | 10578 ▲ | 16716 ▲ | 16513 ▼ | 16521 ▼ | 16697 ▼ | |
| 10344 |
10411 |
11093 ▲ | 10473 ▲ | 19452 ▲ | 19219 ▲ | 19002 ▲ | 18833 ▼ | |
| 9552 |
9852 |
10222 ▲ | 10134 ▲ | 20324 ▲ | 19909 ▼ | 20208 ▲ | 20179 ▼ |
| معدل المواليد حسب الأوبلاست | المواليد/2014 | المواليد /2013 | المواليد/2012 | المواليد/2011 | الوفيات/2014 | الوفيات/2013 | الوفيات/2012 | الوفيات/2011 |
|---|---|---|---|---|---|---|---|---|
| 14.8 |
15.1 |
15.9 ▲ | 15.3 ▲ | 12.7 ▲ | 12.6 ▲ | 12.4 ▲ | 12.3 ▼ | |
| 14.6 |
14.7 |
15.1 ▲ | 14.8 ▲ | 11.8 |
11.8 |
11.8 ▲ | 11.7 ▼ | |
| 14.1 |
14.1 |
14.8 ▲ | 14.1 |
13.2 ▲ | 13.1 ▼ | 13.2 ▼ | 13.3 ▼ | |
| 12.9 ▲ | 12.6 |
12.8 ▲ | 12.5 ▲ | 12.8 ▲ | 12.7 ▲ | 12.5 ▲ | 12.4 ▼ | |
| 12.3 ▲ | 12.1 |
12.7 ▲ | 12.2 ▲ | 14.3 ▲ | 14.0 ▼ | 14.1 |
14.1 ▼ | |
| 12.2 ▲ | 12.1 |
12.4 ▲ | 12.0 ▲ | 12.8 ▲ | 12.6 ▲ | 12.2 ▲ | 12.1 ▼ | |
| 12.1 ▲ | 11.9 |
12.2 ▲ | 11.7 ▲ | 16.4 ▼ | 15.8 |
15.8 ▲ | 15.6 ▼ | |
| 12.1 ▲ | 11.7 |
12.0 ▲ | 11.4 |
10.4 ▲ | 9.8 |
9.8 ▲ | 9.6 ▼ | |
| 12.0 ▲ | 11.9 |
12.2 ▲ | 11.9 ▲ | 16.8 ▲ | 16.5 ▲ | 16.3 ▲ | 16.0 ▼ | |
| 11.9 ▲ | 11.6 |
11.9 ▲ | 11.4 ▲ | 12.8 ▲ | 12.4 ▼ | 12.5 ▲ | 12.3 ▼ | |
| 11.5 ▲ | 11.4 |
11.7 ▲ | 11.1 |
15.1 ▲ | 14.9 ▲ | 14.7 ▲ | 14.6 ▼ | |
| 11.2 ▲ | 11.1 |
11.5 ▲ | 11.0 ▲ | 15.2 ▲ | 14.8 ▲ | 14.7 ▼ | 14.8 ▼ | |
| 11.2 ▲ | 11.1 |
11.3 ▲ | 11.0 ▲ | 15.6 ▼ | 15.7 ▲ | 15.5 ▲ | 15.2 ▼ | |
| 11.1 ▲ | 11.0 |
11.2 ▲ | 10.9 ▲ | 16.0 ▲ | 15.5 |
15.5 ▼ | 15.7 ▼ | |
| 10.9 ▲ | 10.8 |
11.2 ▲ | 10.9 ▲ | 15.9 ▲ | 15.7 ▲ | 15.4 ▼ | 15.5 ▼ | |
| 10.9 |
11.0 |
11.3 ▲ | 11.1 ▲ | 14.2 ▲ | 13.7 ▼ | 13.8 ▲ | 13.7 ▼ | |
| 10.8 ▲ | 10.7 |
11.0 ▲ | 10.5 ▲ | 17.0 ▲ | 16.7 ▲ | 16.5 ▼ | 16.6 ▼ | |
| 10.6 ▲ | 10.2 |
10.6 ▲ | 10.1 ▲ | 15.7 ▲ | 14.9 ▲ | 14.8 ▼ | 15.0 ▼ | |
| 10.1 ▲ | 9.8 |
9.9 ▲ | 9.6 ▲ | 15.3 ▲ | 14.4 ▼ | 14.6 |
14.6 ▼ | |
| 10.0 ▲ | 9.8 |
9.9 ▲ | 9.5 |
17.1 ▲ | 16.7 ▲ | 16.5 ▲ | 16.4 ▼ | |
| 9.8 ▲ | 9.6 |
10.1 ▲ | 9.8 ▲ | 16.5 ▲ | 16.2 |
16.2 ▼ | 16.3 ▼ | |
| 9.2 |
9.2 |
9.7 ▲ | 9.1 ▲ | 17.2 ▲ | 16.9 ▲ | 16.6 ▲ | 16.3 ▼ | |
| 9.0 |
9.2 |
9.4 ▲ | 9.3 ▲ | 19.2 ▲ | 18.6 ▼ | 18.7 ▲ | 18.5 ▼ | |
| 8.2 |
9.4 |
9.8 ▲ | 9.5 ▲ | 16.6 ▲ | 15.9 ▼ | 16.1 |
16.1 ▼ | |
| 5.1 |
9.1 |
9.6 ▲ | 9.3 ▲ | 10.2 ▼ | 15.9 ▼ | 16.0 ▼ | 16.3 ▼ |
استعراض سنة 2013
مقارنة بعام 2012، زاد مقدار التراجع بمقدار 16278 شخصًا، أو 3.1 إلى 3.5 شخص لكل 1000 ساكن حقيقي. لوحظ انخفاض طبيعي في 23 أوبلاست، بينما سجلت الزيادات الطبيعية فقط في العاصمة كييڤ، أوبلاستات زكارپاتيا، ريڤنى وڤولين (على التوالي 5.302، 3.689، 2.889، 1.034 شخصًا).
سجلت بعض المناطق انخفاضًا طبيعيًا منخفضًا، مثل تشيرنيڤستي، إيڤانو-فرانكيڤسك، سيڤاستوپول، لڤيڤ، تيرنوپيل، شبه جزيرة القرم، خرسون وأوديسا (على التوالي، -55، -642، -863، -2.124، -2.875، -2.974، -3.748، و -4،448 شخصًا). تم تسجيل أكبر انخفاض في دونيتسك، لوهانسك، دنيپرو، خاركيڤ، پولتاڤا وتشيرنيهيڤ (على التوالي -28.311، -15.291، - 15.007، -12.765، -10.062، و-10،057) ، وهي مناطق تشترك في انخفاض معدل المواليد وارتفاع معدل الوفيات بين عدد كبير من سكان الحضر وشيخوخة قوية لسكان الريف.
معدل الهجرة الصافي
-5.4 مهاجر/1.000 شخص (2015).
معدل وفيات الأطفال
- 9.1 ▼ متوفى/1.000 طفل مولد حي لكل 4.564 متوفى. (2010)
- 9.0 ▼ متوفى/1.000 طفل مولد حي لكل 4.511 متوفى. (2011)
- 8.4 ▼ متوفى/1.000 طفل مولد حي لكل 4.371 متوفى. (2012)
- 8.0 ▼ متوفى/1.000 طفل مولد حي لكل 4.030 متوفى. (2013)
- 8.9 ▲ متوفى/1.000 طفل مولد حي لكل 2.193 متوفى من يناير-يونيو 2011
- 8.6 ▼ متوفى/1.000 طفل مولد حي لكل 2.190 متوفى من يناير-يونيو 2012
- 7.8 ▼ متوفى/1.000 طفل مولد حي لكل 1.993 متوفى من يناير-يونيو 2013[46]
| وفيات الاطفال حسب الأوبلاست | الوفيات/2012 | الوفيات/2011 | الوفيات/2010 | الوفيات/2009 |
|---|---|---|---|---|
| 540 ▲ | 473 ▼ | 497 ▼ | 533 | |
| 370 ▲ | 343 ▼ | 347 ▲ | 329 ▼ | |
| 267 ▼ | 268 ▲ | 263 ▼ | 280 ▼ | |
| 262 ▲ | 255 ▲ | 233 ▼ | 244 ▼ | |
| 233 ▼ | 272 ▲ | 266 ▲ | 238 ▼ | |
| 203 ▼ | 234 ▼ | 243 ▼ | 252 ▼ | |
| 168 ▼ | 195 ▼ | 199 ▼ | 238 ▲ | |
| 166 ▼ | 186 ▲ | 148 ▼ | 149 ▼ | |
| 165 ▼ | 188 ▼ | 199 ▼ | 252 ▼ | |
| 154 ▼ | 169 ▼ | 182 ▲ | 174 ▼ | |
| 147 ▼ | 156 ▼ | 158 ▼ | 164 ▲ | |
| 134 ▲ | 89 ▼ | 109 ▼ | 174 ▲ | |
| 124 ▼ | 134 ▼ | 135 ▲ | 127 ▲ | |
| 122 ▲ | 101 ▼ | 125 ▼ | 132 ▼ | |
| 119 ▼ | 143 ▲ | 140 ▼ | 146 ▲ | |
| 109 ▼ | 145 ▼ | 170 ▲ | 157 ▼ | |
| 106 ▼ | 116 ▼ | 123 ▲ | 118 ▲ | |
| 103 ▼ | 139 ▲ | 112 ▼ | 119 ▼ | |
| 100 ▼ | 120 ▲ | 116 ▼ | 136 ▼ | |
| 97 |
97 ▼ | 104 ▼ | 112 ▲ | |
| 97 ▲ | 96 ▼ | 98 ▲ | 93 ▼ | |
| 94 ▲ | 80 ▼ | 82 ▼ | 103 ▲ | |
| 92 ▼ | 96 ▲ | 90 ▼ | 91 ▼ | |
| 85 ▼ | 86 ▼ | 87 ▼ | 105 ▼ | |
| 76 ▼ | 78 ▼ | 97 ▲ | 91 ▼ |
| وفيات الأطفال لكل 1.000 حسب الأوبلاست | الوفيات/2012 | الوفيات/2011 | الوفيات/2010 | الوفيات/2009 |
|---|---|---|---|---|
| 12.7 ▲ | 11.4 ▼ | 12.0 ▼ | 12.3 ▲ | |
| 10.0 ▲ | 9.5 ▼ | 9.7 ▲ | 8.8 ▼ | |
| 9.6 ▲ | 8.1 ▼ | 10.0 ▼ | 10.5 ▼ | |
| 9.4 ▼ | 13.2 ▲ | 10.6 ▼ | 10.9 ▼ | |
| 9.2 ▲ | 7.9 ▼ | 8.1 ▼ | 9.9 ▲ | |
| 9.1 ▼ | 10.4 ▲ | 8.4 ▼ | 8.3 ▼ | |
| 9.0 ▲ | 6.2 ▼ | 7.5 ▼ | 11.8 ▲ | |
| 8.9 ▼ | 10.6 ▼ | 10.9 ▼ | 13.1 ▲ | |
| 8.8 ▼ | 9.2 |
9.2 ▼ | 9.7 ▼ | |
| 8.2 ▼ | 9.3 ▼ | 10.1 ▲ | 9.4 ▼ | |
| 8.1 ▼ | 8.9 ▼ | 9.2 ▼ | 9.4 ▲ | |
| 8.0 ▼ | 9.9 ▲ | 9.4 ▼ | 11.0 ▼ | |
| 8.0 ▼ | 8.9 ▼ | 9.1 ▲ | 8.5 ▲ | |
| 8.0 ▼ | 8.5 ▲ | 8.2 |
8.2 ▼ | |
| 8.0 |
8.0 ▼ | 8.2 ▲ | 7.5 ▼ | |
| 7.8 ▼ | 9.4 ▲ | 9.2 ▼ | 8.0 ▼ | |
| 7.8 ▼ | 8.0 ▲ | 7.3 ▼ | 7.5 ▼ | |
| 7.6 ▼ | 8.8 ▼ | 9.4 ▼ | 11.6 ▼ | |
| 7.5 ▼ | 8.9 ▼ | 9.2 ▼ | 9.3 ▼ | |
| 7.3 ▼ | 7.5 ▼ | 8.1 ▼ | 8.5 ▲ | |
| 7.0 ▼ | 7.9 ▼ | 8.2 ▲ | 7.7 ▲ | |
| 6.9 ▼ | 7.5 ▼ | 9.3 ▲ | 8.5 ▼ | |
| 6.4 ▼ | 8.8 ▲ | 10.3 ▲ | 9.1 ▼ | |
| 5.8 ▼ | 6.1 |
6.1 ▼ | 7.1 ▼ | |
| 5.7 ▼ | 7.2 ▲ | 7.0 ▼ | 7.1 ▼ |
معدل الخصوبة الإجمالي حسب الأوبلاست
| الأطفال المولودون حسب الأوبلاست | معدل الخصوبة الإجمالي/2020 | معدل الخصوبة الإجمالي/2012 | معدل الخصوبة الإجمالي/2011 | معدل الخصوبة الإجمالي/2010 |
|---|---|---|---|---|
| 1.54 |
2.08 ▲ | 1.99 ▲ | 1.93 ▲ | |
| 1.60 |
1.95 ▲ | 1.90 ▲ | 1.83 | |
| 1.51 |
1.92 ▲ | 1.81 |
1.85 | |
| 1.20 |
1.71 ▲ | 1.65 ▲ | 1.61 ▲ | |
| 1.34 |
1.71 ▲ | 1.62 ▲ | 1.58 | |
| 1.18 |
1.67 ▲ | 1.58 |
1.58 | |
| 1.30 |
1.64 ▲ | 1.58 ▲ | 1.53 | |
| 1.26 |
1.62 ▲ | 1.56 ▲ | 1.55 | |
| 1.27 |
1.63 ▲ | 1.55 |
1.58 | |
| 1.20 |
1.61 ▲ | 1.51 |
1.51 ▲ | |
| 1.10 |
1.61 ▲ | 1.51 ▲ | 1.50 ▲ | |
| 1.24 |
1.58 ▲ | 1.49 |
1.50 | |
| 1.11 |
1.57 ▲ | 1.47 ▲ | 1.44 | |
| 1.20 |
1.59 ▲ | 1.53 ▲ | 1.50 | |
| 1.22 |
1.53 ▲ | 1.46 ▲ | 1.45 | |
| 1.09 |
1.52 ▲ | 1.44 ▲ | 1.43 | |
| 1.13 |
1.50 ▲ | 1.45 |
1.46 | |
| 1.03 |
1.46 ▲ | 1.37 ▲ | 1.34 | |
| 1.04 |
1.41 ▲ | 1.33 |
1.34 ▲ | |
| 1.01 |
1.43 ▲ | 1.37 ▲ | 1.36 ▲ | |
| 1.02 |
1.40 ▲ | 1.36 |
1.36 ▲ | |
| 1.44 |
1.38 ▲ | 1.29 |
1.30 | |
| 1.34 ▲ | 1.27 ▲ | 1.26 | ||
| 0.98 |
1.32 ▲ | 1.25 ▲ | 1.24 | |
| 0.93 |
1.36 ▲ | 1.25 ▲ | 1.23 | |
| 1.33 ▲ | 1.27 ▲ | 1.23 |
إحصائيات ديموغرافية أخرى
الاحصائيات الديموغرافية حسب المراجعة السكانية العالمية 2019.[47]
- مولود كل 1 دقيقة
- متوفى كل 48 ثانية
- الخسارة السافية شخص كل 2 دقيقة
- الهجرة الصافية 1 لكل 30 دقيقة
الإحصاءات الديموغرافية حسب كتاب حقائق العالم، ما لم يُذكر خلاف ذلك.[30]
- السكان
- 43.952.299 (تقديرات يوليو 2018)
- 44.033.874 )تقديرات يوليو 2017)
 45.426.249 (1 يناير 2013)[48]
- التركيبة العمرية
- 0-14 سنة: 15.95% (3.609.386 ذكر/3.400.349 أنثى)
- 15-24 سنة: 9.57% (2.156.338 ذكر/2.047.821 أنثى)
- 25-54 سنة: 44.03% (9.522.108 ذكر/9.831.924 أنثى)
- 55-64 سنة: 13.96% (2.638.173 ذكر/3.499.718 أنثى)
- 65 سنة وأكثر: 16.49% (2.433.718 ذكر/4.812.764 أنثى) (تقديرات 2018)
- 0-14 سنة: 15.76% (3.571.358 ذكر/ 3.366.380 أنثى)
- 15-24 سنة: 9.86% (2.226.142 ذكر/ 2.114.853 أنثى)
- 25-54 سنة: 44.29% (9.579.149 ذكر/ 9.921.387 أنثى)
- 55-64 سنة: 13.8% (2.605.849 ذكر/ 3.469.246 أنثى)
- 65 سنة وأكثر: 16.3% (2.409.049 ذكر/ 4.770.461 أنثى) (تقديرات 2017)
- 0–14 سنة: 15.1% = 6,449,171 (الرسمي 2015)
- 15–64 سنة: 69.3% = 29,634,710
- 65 سنة وأكثر: 15.6% = 6,675,780
- 0–14 سنة: 14.8% = 6,989,802
- 15–64 سنة: 69.2% = 32,603,475
- 65 سنة وأكثر: 16.0% = 7,507,185 (الرسمي 2005)
- 0–14 سنة: 21.6% = 11,101,469
- 15–64 سنة: 66.7% = 34,320,742
- 65 سنة وأكثر: 11.7% = 6,022,934 (الرسمي 1989)
- العمر المتوسط
- الإجمالي: 40.8 سنة. مقارنة البلد بالعالم: رقم 47
- الذكور: 37.7 سنة
- الإناث: 43.9 سنة (تقديرات 2018)
- الإجمالي: 40.6 سنة
- الذكور: 37.4 سنة
- الإناث: 43.7 سنة (تقديرات 2017)
- الإجمالي: 39.8 سنة
- الذكور: 39.7 سنة
- الإناث: 40.1 سنة (الرسمي 2014)
- الإجمالي: 39.7 سنة
- الذكور: 39.5 سنة
- الإناث: 40.1 سنة (الرسمي 2013)
- الإجمالي: 34.8 سنة
- الذكور: 31.9 سنة
- الإناث: 37.7 سنة (الرسمي 1989)
- معدل المواليد
- 10.1 مولود/1.000 شخص (تقديرات 2018)، مقارنة البلاد بالعالم: رقم 190
- 10.3 مولود/1.000 شخص (تقديرات 2017)
- معدل الوفيات
- 14.3 متوفى/1.000 شخص (تقديرات 2018)، مقارنة البلاد بالعالم: رقم 6
- 14.4 متوفى/1.000 شخص (تقديرات 2017)
- معدل الخصوبة الإجمالي
- 1.55 طفل مولود/امرأة (تقديرات 2018)، مقارنة البلاد بالعالم: رقم 190
- 1.54 طفل مولود/امرأة (تقديرات 2017)
- معدل الهجرة الصافي
- 4.6 مهاجر/1.000 شخص (تقديرات 2018)، مقارن البلاد بالعالم: رقم 29
- 0 مهاجر/1.000 شخص (تقديرات 2017)
- متوسط عمر الأم عند أول ولادة
- 24.9 سنة (تقديرات 2014)
- معدل النمو السكاني
- 0.04% (تقديرات 2018) مقارنة البلاد بالعالم: رقم 187
- -0.41% (تقديرات 2017)
- العمر المتوقع عند الميلاد
- إجمالي السكان: 72.4 سنة. مقارنة البلاد بالعالم: رقم 148
- الذكور: 67.7 سنة
- الإناث: 77.4 سنة (تقديرات 2018)
- الجماعات العرقية
أوكرانيون 77.8%، روس 17.3%، بلاروس 0.6%، مولدوڤيون 0.5%، تتار القرم 0.5%، بلغار 0.4%، مجريون 0.3%، رومانيون 0.3%، پولنديون 0.3%، يهود 0.2%، آخرون 1.8% (تقديرات 2001)
- اللغات
الأوكرانية (الرسمية) 67.5%، الروسية (لغة إقليمية) 29.6^، أخرى (تتضمن الأقليات الناطقة بتتار القرم، المولدوڤية/الرومانية، والمجرية) 2.9% (تقديرات 2001)
ملاحظة: في فبراير 2018 ، قضت المحكمة الدستورية بأن التشريع اللغوي لعام 2012 يمنح اللغة التي يتحدث بها ما لا يقل عن 10٪ من سكان الأوبلاست وضع "اللغة الإقليمية" - مما يسمح باستخدامها في المحاكم والمدارس والمؤسسات الحكومية الأخرى - كان غير دستوري ، مما يجعل القانون باطلًا ؛ تظل الأوكرانية هي الرسمية الوحيدة في البلاد على الصعيد الوطني.
- الديانات
الأرثوذكسية، الروم الكاثوليك، الروم الكاثوليك، الپروتستانتية، الإسلام، اليهودية
- معدل التبعية
- معدل التبعية الإجمالية: 44.8 (تقديرات 2015)
- معدل تبعية الشباب: 21.8 (تقديرات 2015)
- معدل تبعية المسنين: 23 (تقديرات 2015)
- معدل الدعم المحتمل: 4.3 (تقديرات 2015)
- ملحوظة: البيانات لا تشمل القرم
- التمدن
- سكان الحضر: 69.4% من إجمالي السكان (2018)
- معدل التمدن: -0.33% معدل التغير السنوي (تقديرات 2015-20)
- معرفة القراءة والكتابة
التعريف: 15 سنة وأكثر يعرفون القراءة والكتابة (تقديرات 2015)
- إجمالي السكان: 99.8%
- الذكور: 99.8%
- الإناث: 99.7% (تقديرات 2015)
- العمر المتوقع لدخول المدارس (الابتدائي حتى الثانوي)
- الإجمالي: 15 سنة
- الذكور: 15 سنة
- الإناث: 16 سنة (2014)
- البطالة، عمر الشباب بين 15–24
- الإجمالي: 23%. مقارنة البلاد بالعالم: رقم 53
- الذكور: 24%
- الإناث: 21.5% (تقديرت 2016)
Statistic rate of regional capitals
| Birth rate in
regional centers |
Birth/2012 | Birth/2011 | Birth/2010 | Birth/2009 | Birth/2007 | Birth/2005 | Birth/2003 |
|---|---|---|---|---|---|---|---|
| Simferopol | 13.6 ▲ | 12.8 ▲ | 11.8 |
11.8 ▲ | 11.0 ▲ | 9.5 ▲ | 9.2 ▲ |
| Lutsk | 12.6 ▲ | 12.3 |
12.6 |
13.9 ▲ | 12.6 ▲ | 11.7 ▲ | 10.0 ▲ |
| Rivne | 12.6 ▲ | 12.0 ▲ | 11.8 |
12.3 ▲ | 10.9 ▲ | 10.1 |
9.4 ▲ |
| Uzhhorod | 12.1 ▲ | 11.9 |
12.0 |
12.4 ▲ | 12.8 ▲ | 12.6 ▲ | 10.8 |
| Kyiv | 12.0 ▲ | 11.4 |
11.5 |
11.7 ▲ | 10.4 ▲ | 9.8 ▲ | 8.8 ▲ |
| Khmelnytskyi | 12.0 ▲ | 11.2 |
11.8 ▲ | 11.5 ▲ | 10.4 |
10.2 ▲ | 9.2 ▲ |
| Sevastopol | 12.0 ▲ | 11.1 ▲ | 11.0 |
11.2 ▲ | 10.5 ▲ | 9.6 ▲ | 8.7 ▲ |
| Kherson | 11.9 ▲ | 11.1 ▲ | 10.1 ▲ | 10.5 ▲ | 9.6 |
8.6 |
8.5 ▲ |
| Ternopil | 11.8 |
12.2 ▲ | 11.7 |
12.3 ▲ | 11.9 ▲ | 11.6 ▲ | 10.4 ▲ |
| Ivano-Frankivsk | 11.6 |
11.6 ▲ | 10.1 |
10.8 |
11.3 ▲ | 10.7 ▲ | 9.3 ▲ |
| Vinnytsia | 11.5 ▲ | 11.2 ▲ | 10.9 |
11.1 ▲ | 10.1 ▲ | 9.4 ▲ | 9.1 ▲ |
| Kropyvnytskyi | 11.5 ▲ | 11.1 ▲ | 10.5 |
11.3 |
10.5 ▲ | 8.9 ▲ | 8.4 |
| Zhytomyr | 11.4 |
11.5 ▲ | 10.8 |
11.7 ▲ | 10.6 ▲ | 9.5 ▲ | 8.7 ▲ |
| Sumy | 11.3 ▲ | 10.3 ▲ | 10.0 |
10.3 |
9.6 ▲ | 8.2 ▲ | 7.8 ▲ |
| Lviv | 11.0 ▲ | 10.4 ▲ | 10.0 |
10.5 ▲ | 9.7 ▲ | 9.3 |
9.0 ▲ |
| Ukraine Urban | 10.9 ▲ | 10.5 ▲ | 10.4 |
10.8 |
9.9 ▲ | 8.9 |
8.3 ▲ |
| Dnipro | 10.5 ▲ | 10.2 ▲ | 10.0 |
10.5 |
9.4 ▲ | 8.5 ▲ | 7.9 ▲ |
| Luhansk | 10.5 ▲ | 9.8 ▲ | 8.8 |
9.2 |
8.2 ▲ | 7.4 |
6.8 ▲ |
| Chernivtsi | 10.2 |
10.3 ▲ | 10.1 |
10.2 |
9.2 ▲ | 9.6 ▲ | 8.3 ▲ |
| Odessa | 10.1 ▲ | 9.8 ▲ | 9.6 |
9.9 |
9.0 ▲ | 8.3 ▲ | 7.5 |
| Cherkasy | 9.9 ▲ | 9.4 |
9.4 |
9.4 |
8.7 ▲ | 7.8 |
7.4 |
| Poltava | 9.9 ▲ | 9.1 ▲ | 8.8 |
9.7 |
8.4 ▲ | 7.8 ▲ | 7.3 ▲ |
| Zaporizhzhia | 9.5 ▲ | 9.2 |
9.2 |
9.3 |
8.9 ▲ | 8.2 ▲ | 7.5 |
| Mykolaiv | 9.4 ▲ | 9.3 ▲ | 9.1 |
9.4 |
8.7 ▲ | 8.0 |
7.9 ▲ |
| Chernihiv | 9.3 ▲ | 9.2 ▲ | 9.1 |
9.6 |
8.4 ▲ | 8.0 ▲ | 7.6 ▲ |
| Kharkiv | 9.2 ▲ | 8.9 ▲ | 8.8 |
9.2 |
8.4 ▲ | 7.6 ▲ | 7.1 ▲ |
| Donetsk | 9.1 ▲ | 8.7 ▲ | 8.6 |
9.0 |
8.2 ▲ | 7.5 ▲ | 6.6 ▲ |
| Death rate in
regional centers |
Death/2012 | Death/2011 | Death/2010 | Death/2009 | Death/2007 | Death/2005 | Death/2003 |
|---|---|---|---|---|---|---|---|
| Kherson | 15.2 ▼ | 15.6 ▲ | 14.0 ▼ | 14.2 ▼ | 14.9 ▼ | 14.8 ▼ | 14.5 ▼ |
| Luhansk | 14.2 ▼ | 14.3 ▲ | 13.6 ▲ | 13.4 ▼ | 13.8 ▼ | 14.2 ▼ | 14.1 ▲ |
| Simferopol | 14.0 ▼ | 14.8 ▲ | 13.6 ▼ | 13.8 ▼ | 15.3 |
15.3 ▲ | 15.2 ▼ |
| Sevastopol | 13.7 ▼ | 14.1 ▼ | 14.7 ▲ | 14.5 ▼ | 15.5 ▲ | 15.4 ▲ | 14.1 ▲ |
| Kropyvnytskyi | 13.7 |
13.7 ▼ | 13.8 ▼ | 14.0 ▼ | 14.4 ▲ | 14.1 |
14.1 ▲ |
| Dnipro | 13.5 ▼ | 13.7 ▼ | 14.1 ▲ | 13.8 ▼ | 15.1 |
15.1 ▼ | 16.0 ▼ |
| Donetsk | 13.4 ▼ | 13.5 ▼ | 14.0 ▲ | 13.9 ▼ | 15.2 ▼ | 15.4 ▲ | 14.7 ▲ |
| Zaporizhzhia | 13.2 ▼ | 13.4 ▼ | 14.2 ▲ | 13.8 ▼ | 15.0 ▲ | 14.7 ▲ | 14.2 ▼ |
| Ukraine Urban | 13.1 |
13.1 ▼ | 13.7 |
13.7 ▼ | 14.7 ▲ | 14.8 ▲ | 14.3 ▲ |
| Mykolaiv | 12.8 |
12.8 ▼ | 13.8 |
13.8 ▼ | 14.5 |
14.5 ▼ | 14.9 ▲ |
| Poltava | 12.8 ▲ | 12.6 ▼ | 13.2 ▲ | 13.0 ▼ | 13.7 ▲ | 13.6 |
13.6 ▲ |
| Sumy | 12.1 ▲ | 11.9 ▼ | 12.4 ▼ | 12.6 ▼ | 13.0 ▼ | 13.1 ▲ | 11.9 ▼ |
| Kharkiv | 12.0 ▲ | 11.8 ▼ | 12.4 ▲ | 12.2 ▼ | 13.1 |
13.1 ▲ | 13.0 ▼ |
| Odessa | 11.9 ▼ | 12.2 ▼ | 13.0 ▲ | 12.5 ▼ | 13.9 ▲ | 14.1 ▼ | 14.0 ▼ |
| Cherkasy | 11.2 ▲ | 10.7 ▼ | 11.3 ▲ | 11.2 ▼ | 11.7 |
11.7 ▲ | 11.0 ▼ |
| Chernihiv | 11.4 ▲ | 11.1 ▼ | 12.0 ▲ | 11.8 ▼ | 12.5 ▼ | 12.4 ▲ | 12.0 ▼ |
| Lviv | 11.0 ▲ | 10.8 ▲ | 10.5 ▼ | 10.8 ▼ | 11.5 ▲ | 11.4 ▼ | 11.5 ▲ |
| Zhytomyr | 10.7 ▼ | 10.9 ▼ | 11.2 ▲ | 11.1 ▼ | 12.0 ▼ | 12.2 ▲ | 11.4 ▲ |
| Uzhhorod | 10.3 ▲ | 10.2 ▼ | 10.5 ▼ | 11.3 ▼ | 12.0 ▼ | 12.4 ▲ | 10.3 ▲ |
| Kyiv | 9.8 ▲ | 9.6 ▼ | 10.3 ▲ | 10.2 ▼ | 11.4 ▲ | 11.2 ▲ | 10.7 ▲ |
| Lutsk | 9.6 ▲ | 9.4 ▼ | 9.6 ▲ | 9.1 ▼ | 10.4 ▲ | 10.2 ▼ | 10.5 ▲ |
| Chernivtsi | 9.5 ▲ | 9.4 ▼ | 9.9 ▼ | 10.3 ▼ | 11.0 |
11.0 ▲ | 10.8 ▲ |
| Khmelnytskyi | 9.4 ▲ | 8.8 ▼ | 9.0 ▼ | 9.5 ▲ | 9.8 |
9.8 ▲ | 9.2 ▲ |
| Vinnytsia | 9.1 ▲ | 9.0 ▼ | 9.2 |
9.2 ▼ | 10.2 |
10.2 ▲ | 10.0 ▲ |
| Ivano-Frankivsk | 9.1 ▲ | 8.7 ▲ | 8.2 ▼ | 8.5 ▼ | 9.1 ▼ | 9.3 |
9.3 ▲ |
| Ternopil | 8.1 ▲ | 7.6 ▼ | 8.1 ▲ | 7.7 ▼ | 8.5 |
8.5 ▲ | 7.7 ▼ |
| Rivne | 7.9 ▲ | 7.8 ▼ | 8.7 ▲ | 8.6 ▼ | 9.0 ▲ | 9.2 ▲ | 8.8 ▼ |
Ethnic groups
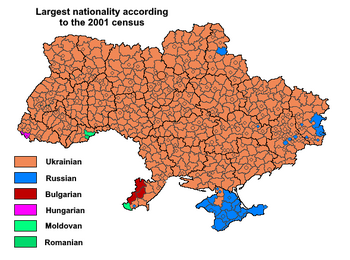
In 2001, the ethnic composition was: Ukrainians 77.8%, Russian 17.3%, Romanian 1.1% (including Moldovan 0.8%), Belarusian 0.6%, Crimean Tatar 0.5%, Bulgarian 0.4%, Hungarian 0.3%, Polish 0.3%, Jewish 1.0%, Pontic Greeks 0.2% and other 1.6% (including Muslim Bulgarians, otherwise known as Torbesh and a microcosm of Swedes of Gammalsvenskby).[49] It is also estimated that there are about 49,817 ethnic Koreans (0.12%) in Ukraine that belong to the Koryo-saram group. Their number may be as high as 100.000 as many ethnic Koreans were assimilated into the majority population.[50][51]
Before World War II
| Ethnic group |
census 19261 | census 19392 | ||
|---|---|---|---|---|
| Number | % | Number | % | |
| Ukrainians | 23,218,860 | 80.0 | 23,667,509 | 76.5 |
| Russians | 2,677,166 | 9.2 | 4,175,299 | 13.5 |
| Jews | 1,574,428 | 5.4 | 1,532,776 | 5.0 |
| Germans | 393,924 | 1.4 | 392,458 | 1.3 |
| Poles | 476,435 | 1.6 | 357,710 | 1.2 |
| Moldavians / Romanians | 257,794 | 0.9 | 230,698 | 0.8 |
| Belarusians | 75,842 | 0.3 | 158,174 | 0.5 |
| Pontic Greeks | 104,666 | 0.4 | 107,047 | 0.4 |
| Bulgarians | 99,278 | 0.3 | 83,838 | 0.3 |
| Tatars | 22,281 | 0.1 | 55,456 | 0.2 |
| Romani | 13,578 | 0.0 | 10,443 | 0.0 |
| Others | 103,935 | 0.4 | 174,810 | 0.6 |
| Total | 29,018,187 | 30,946,218 | ||
| 1 Source: [2]. | ||||
After World War II
| Ethnic group |
census 19591 | census 19702 | census 19793 | census 19894 | census 20015 | |||||
|---|---|---|---|---|---|---|---|---|---|---|
| Number | % | Number | % | Number | % | Number | % | Number | % | |
| Ukrainians | 32,158,493 | 76.8 | 35,283,857 | 74.9 | 36,488,951 | 73.6 | 37,419,053 | 72.7 | 37,541,693 | 77.5 |
| Russians | 7,090,813 | 16.9 | 9,126,331 | 19.4 | 10,471,602 | 21.1 | 11,355,582 | 22.1 | 8,334,141 | 17.2 |
| Romanians / Moldovans | 391,753 | 1.1 | 378,043 | 1.1 | 415,371 | 1.1 | 459,350 | 1.2 | 409,608 | 1.1 |
| Belarusians | 290,890 | 0.7 | 385,847 | 0.8 | 406,098 | 0.8 | 440,045 | 0.9 | 275,763 | 0.6 |
| Crimean Tatars | 193 | 0.0 | 3,554 | 0.0 | 6,636 | 0.0 | 46,807 | 0.1 | 248,193 | 0.5 |
| Bulgarians | 219,419 | 0.5 | 234,390 | 0.5 | 238,217 | 0.5 | 233,800 | 0.5 | 204,574 | 0.4 |
| Hungarians | 149,229 | 0.4 | 157,731 | 0.3 | 164,373 | 0.3 | 163,111 | 0.3 | 156,566 | 0.3 |
| Poles | 363,297 | 0.9 | 295,107 | 0.6 | 258,309 | 0.5 | 219,179 | 0.4 | 144,130 | 0.3 |
| Jews | 840,311 | 2.0 | 777,126 | 1.7 | 634,154 | 1.3 | 486,628 | 1.0 | 103,591 | 0.2 |
| Armenians | 28,024 | 0.1 | 33,439 | 0.1 | 38,646 | 0.1 | 54,200 | 0.1 | 99,894 | 0.2 |
| Greeks | 104,359 | 0.3 | 106,909 | 0.2 | 104,091 | 0.2 | 98,594 | 0.2 | 91,548 | 0.2 |
| Tatars | 61,334 | 0.2 | 72,658 | 0.2 | 83,906 | 0.2 | 86,875 | 0.2 | 73,304 | 0.2 |
| Romani | 22,515 | 0.1 | 30,091 | 0.1 | 34,411 | 0.1 | 47,917 | 0.1 | 47,587 | 0.1 |
| Azerbaijanis | 6,680 | 0.0 | 10,769 | 0.0 | 17,235 | 0.0 | 36,961 | 0.1 | 45,176 | 0.1 |
| Georgians | 11,574 | 0.0 | 14,650 | 0.0 | 16,301 | 0.0 | 23,540 | 0.1 | 34,199 | 0.1 |
| Germans | 23,243 | 0.1 | 29,871 | 0.1 | 34,139 | 0.1 | 37,849 | 0.1 | 33,302 | 0.1 |
| Gagauz | 23,530 | 0.1 | 26,464 | 0.1 | 29,398 | 0.1 | 31,967 | 0.1 | 31,923 | 0.1 |
| Karaites | 3,301 | 0.0 | 2,596 | 0.0 | 1,845 | 0.0 | 1,404 | 0.0 | 1,196 | 0.0 |
| Others | 129,338 | 0.3 | 157,084 | 0.3 | 165,650 | 0.3 | 209,172 | 0.4 | 363,821 | 1.1 |
| Total | 41,869,046 | 47,126,517 | 49,609,333 | 51,452,034 | 48,240,902 | |||||
| 1 Source: [3]. 2 Source: [4]. 3 Source: [5]. 4 Source: [6]. 5 Source: [7]. | ||||||||||
Ethnic Groups in Ukraine 2001[52]
Languages
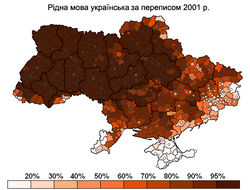
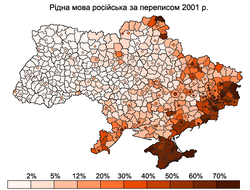
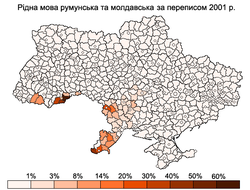
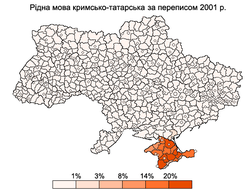
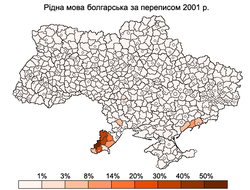
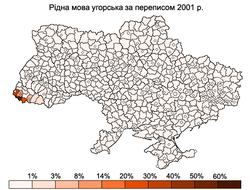
According to the latest census that took place, the following languages are common in Ukraine Ukrainian 67.5%, Russian 29.6%, Crimean Tatar, Urum (Turkic Greeks), Bulgarian, Moldovan/Romanian, Polish, Hungarian. The below table gives the total population of various ethnic groups in Ukraine and the primary language, according to the 2001 census.[49]
| Ethnic group | Population | Native | Ukrainian | Russian | Other |
|---|---|---|---|---|---|
| Ukrainians | 37,541,693 | 31,970,728 | – | 5,544,729 | 532 |
| Russians | 8,334,141 | 7,993,832 | 328,152 | – | 402 |
| Moldovans | 258,619 | 181,124 | 27,775 | 45,607 | 1242 |
| Belarusians | 275,763 | 54,573 | 48,202 | 172,251 | |
| Crimean Tatars | 248,193 | 228,373 | 184 | 15,208 | 43 |
| Bulgarians | 204,574 | 131,237 | 10,277 | 62,067 | 9 |
| Hungarians | 156,566 | 149,431 | 5,367 | 1,513 | 14 |
| Romanians | 150,989 | 138,522 | 9,367 | 2,297 | 170 |
| Poles | 144,130 | 18,660 | 102,268 | 22,495 | 390 |
| Jews | 103,591 | 3,213 | 13,924 | 85,964 | 16 |
| Armenians | 99,894 | 50,363 | 5,798 | 43,105 | 11 |
| Greeks | 91,548 | 5,829 | 4,359 | 80,992 | 9 |
| Tatars | 73,304 | 25,770 | 3,310 | 43,060 | 6 |
| Koreans | 49,817 | 2,223 | 37,932 | 9,662 | 0 |
| Romani people | 47,587 | 21,266 | 10,039 | 6,378 | 6 |
| Azerbaijanis | 45,176 | 23,958 | 3,224 | 16,968 | 36 |
| Georgians | 34,199 | 12,539 | 2,818 | 18,589 | 15 |
| Germans | 33,302 | 4,056 | 7,360 | 21,549 | 20 |
| Gagauz | 31,923 | 22,822 | 1,102 | 7,232 | 2 |
| Uzbeks | 12,353 | 3,604 | 1,818 | 5,996 | 0 |
| Chuvash | 10,593 | 2,268 | 564 | 7,636 | 1 |
| Mordvinians | 9,331 | 1,473 | 646 | 7,168 | 0 |
| Turks | 8,844 | 7,923 | 133 | 567 | 0 |
| Lithuanians | 7,207 | 1,932 | 1,029 | 4,182 | 4 |
| Arabs | 6,575 | 4,071 | 897 | 1,235 | 0 |
| Slovaks | 6,397 | 2,633 | 2,665 | 335 | 0 |
| Czechs | 5,917 | 1,190 | 2,503 | 2,144 | 2 |
| Kazakhs | 5,526 | 1,041 | 822 | 3,470 | 11 |
| Latvians | 5,079 | 957 | 872 | 3,188 | 1 |
| Ossetians | 4,834 | 1,150 | 401 | 3,110 | 4 |
| Udmurts | 4,712 | 729 | 380 | 3,515 | 0 |
| Lezghinians | 4,349 | 1,507 | 330 | 2,341 | 4 |
| Tadjiks | 4,255 | 1,521 | 488 | 1,983 | 0 |
| Bashkirs | 4,253 | 843 | 336 | 2,920 | 0 |
| Mari people | 4,130 | 1,059 | 264 | 2,758 | 7 |
| Thai | 3,850 | 3,641 | 29 | 164 | 0 |
| Turkmens | 3,709 | 719 | 1,079 | 1,392 | 0 |
| Albanians | 3,308 | 1,740 | 301 | 1,181 | 0 |
| Assyrians | 3,143 | 883 | 408 | 1,730 | 0 |
| Chechens | 2,877 | 1,581 | 212 | 977 | 0 |
| Estonians | 2,868 | 416 | 321 | 2,107 | 4 |
| Chinese people | 2,213 | 1,817 | 73 | 307 | 0 |
| Kurds | 2,088 | 1,173 | 236 | 396 | 0 |
| Darghins | 1,610 | 409 | 199 | 955 | 0 |
| Komis | 1,545 | 330 | 127 | 1,046 | 0 |
| Karelians | 1,522 | 96 | 145 | 1,244 | 1 |
| Avars | 1,496 | 582 | 121 | 761 | 0 |
| India-Bangladesh-Pakistan | 1,483 | 1,092 | 26 | 192 | 0 |
| Abkhazians | 1,458 | 317 | 268 | 797 | 0 |
| Karaites | 1,196 | 72 | 160 | 931 | 0 |
| Komi-Permians | 1,165 | 160 | 79 | 898 | 1 |
| Kyrgyz people | 1,128 | 208 | 221 | 617 | 19 |
| Laks | 1,019 | 199 | 271 | 514 | 13 |
| Afghans | 1,008 | 551 | 60 | 213 | 0 |
| other | 3,228 | 1,027 | 144 | 790 | 0 |
| NA | 188,639 | 0 | 1,108 | 1,844 | 1 |
| Ukrainian | Russian | Romanian and Moldovan |
| Crimean Tatar | Bulgarian | Hungarian |
Religion
A 2016 survey conducted by the Razumkov Centre found that 70% of the population declared themselves believers in any religion, while 6.3% declared themselves non-believers, and 2.7% declared to be atheists.[53] Of the total Ukrainian population, 81.9% declared to be Christians, comprising a 63.4% who declared to be Orthodox, 8.5% Greek Rite Catholics, 7.1% simply Christians, 1.9% Protestants, and 1.0% Latin Rite Catholics. Islam comprises 2% of the population, while Judaism were the religions of 0.2% of the population each.
According to data from 2008 among those Ukrainians who declared to believe in Orthodoxy, 38.1% declared to be members of the Ukrainian Orthodox Church of the Kyivan Patriarchate (being incorporated as of the 5 January 2019 into the Orthodox Church of Ukraine), while 23.0% declared to be members of the Ukrainian Orthodox Church of the Moscovian Patriarchate (which is an autonomous Orthodox church under the Russian Orthodox Church). A further 2.7% were members of the Ukrainian Autocephalous Orthodox Church, which, like the Kyivan Patriarchate, where incorporated in 2019 into the Orthodox Church of Ukraine.[54] Among the remaining Orthodox Ukrainians, 32.3% declared to be "simply Orthodox", without affiliation to any patriarchate, while a further 3.1% declared that they "did not know" which patriarchate or Orthodox church they belonged to.[53]
Regional differences
Regional differences in population change
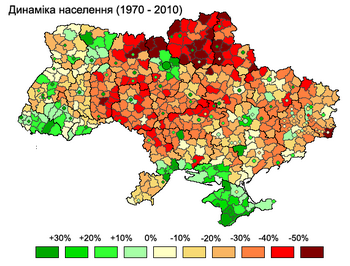
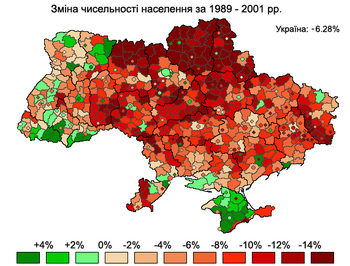
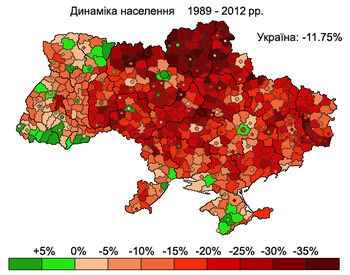
Between the Soviet census of 1989 and the Ukrainian census of 2001, Ukraine's population declined from 51,706,600 to 48,457,020,[3] a loss of 2,926,700 people or 5.7% of the 1989 population. However, this trend has been quite uneven and varied regionally. Two regions in western Ukraine — Rivne and Zakarpattia, saw slight population increases of 0.3% and 0.5% respectively. A third western Ukrainian region, Volyn, lost less than 0.1% of its population between 1989 and 2001.[3] Collectively, between 1989 and 2001 the seven westernmost regions of Ukraine lost 167,500 people or 1.7% of their 1989 population. The total population of these regions in 2001 was 9,593,800.[3]
Between 1989 and 2001, the population of Kyiv City increased by 0.3%[3] due to positive net-migration.[بحاجة لمصدر] Outside the capital, the central, southern and eastern regions experienced a severe decline in population. Between 1989 and 2001, the Donetsk region lost 491,300 people or 9.2% of its 1989 population, and neighbouring Luhansk region lost 11% of its population.[3] Chernihiv region, in central Ukraine northeast of Kyiv, lost 170,600 people or 12% of its 1989 population, the highest percentage loss in of any region in Ukraine. In southern Ukraine, Odessa region lost 173,600 people, or 6.6% of its 1989 population. By 2001, Crimea's population declined by 29,900 people, representing only 1.4% loss of the 1989 population.[3]
However, this was due to the influx of approximately 200,000 Crimean Tatars – a number equivalent to approximately 10% of Crimea's 1989 population – who arrived in Crimea after 1989 and whose population in that region increased by a factor of 6.4 from 38,000 to 243,400 between 1989 and 2001.[55] Collectively, the net population loss in the regions of Ukraine outside the westernmost regions was 2,759,200 people or 6.6% of the 1989 population. The total population of these regions in 2001 was 39,186,100.[3]
Thus, from 1989–2001 the pattern of population change was one of slight growth in Kyiv, slight declines in western Ukraine, large declines in eastern, central and southern Ukraine and a relatively small decline in Crimea due to a large influx of Crimean Tatars.
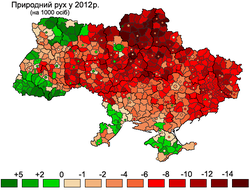
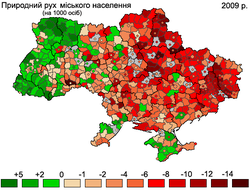
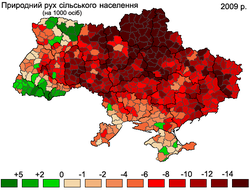
| All population, 2012 | Urban population, 2009 | Rural population, 2009 |
Regional differences in birth and fertility rates
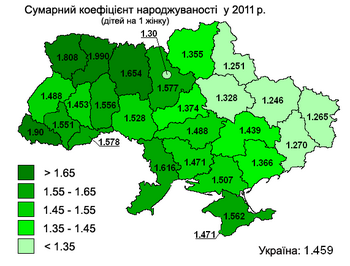
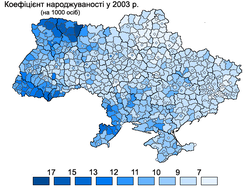
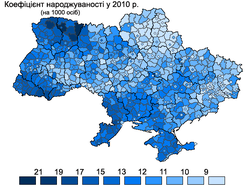
Ukraine's total fertility rate is one of the lowest in Europe.[56][57] However, significant regional differences in birth rates may account for some of the demographic differences. In the third quarter of 2007, for instance, the highest birth rate among Ukrainian regions occurred in Volyn Oblast, with a birth rate of 13.4/1,000 people, compared to the Ukrainian country-wide average of 9.6/1,000 people.[58] Volyn's birthrate is higher than the average birth rate of any European country with the exceptions of Iceland and Albania.[59]
In 2007, for the first time since 1990, five Ukrainian regions (Zakarpattia Oblast, Rivne Oblast, Volyn Oblast, Lviv Oblast, and Kyiv Oblast) experienced more births than deaths.[60] This demonstrates a positive trend of increasing birthrates in the last couple of years throughout Ukraine. The ratio of births to deaths in those regions in 2007 was 119%, 117%, 110%, 100.7%, and 108%, respectively.[60]
With the exception of Kyiv region, all of the regions with more births than deaths were in the less industrially developed regions of western Ukraine. According to a spokesperson for Ukraine's Ministry of Justice, the overall ratio of births to deaths in Ukraine had improved from 1 to 1.7 in 2004–2005 to 1 to 1.4 in 2008. However, the worst birth to death ratios in the country were in the eastern and central oblasts of Donetsk, Luhansk, Cherkasy and Poltava. In these regions, for every birth there were 2.1 deaths.[61]
Notably, western Ukraine never experienced the Holodomor, as Poland, Czechoslovakia, and Romania ruled it at the time, helping to explain the better demographics there, as the rural population was never devastated. Specifically, during the time of the Holodomor, Poland ruled Ivano-Frankivsk, Lviv, Rivne, Ternopil, and Volyn Oblasts, whereas Zakarpattia Oblast was under Czechoslovak rule, and Romania controlled Chernivtsi Oblast and the Budjak section of Odessa Oblast.
Abortion behavior in the North, South, East and Center regions of Ukraine are relatively homogeneous while the Western region differs greatly. Overall, the abortion rate in western Ukraine is three times lower than in other regions; however this is not due to an increased use of modern contraceptive methods in the West, but simply due to the fact that pregnant women in the Western regions are more likely to keep their babies.[62] Donetsk and Dniproptrovsk oblasts in eastern and central Ukraine have the country's highest rate of abortions.[63]
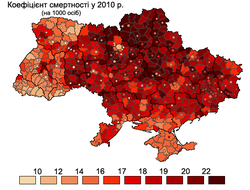
| The birth rate in Ukraine, 2003. | The birth rate in Ukraine, 2010. | The death rate in Ukraine, 2010. |
Regional differences and death rates and health
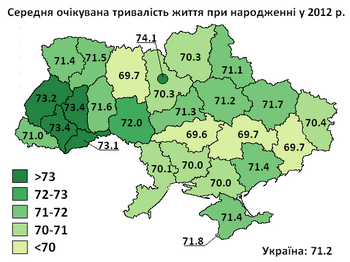
Death rates also vary widely by region; Eastern and southern Ukraine have the highest death rates in the country, and the life expectancy for children born in Chernihiv, Dnipropetrovsk, Donetsk, Kherson, Kropyvnytskyi, Luhansk, Mikolaiv, and Odessa regions is 1.5 years lower than the national average.[64]
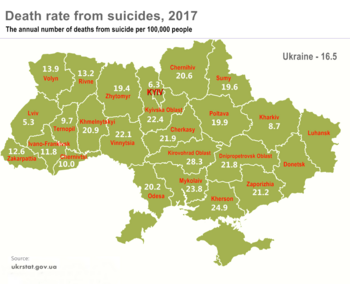
Ukraine had a suicide rate of 16.5 per 100,000 population in 2017, a significant decrease from the suicide rate of 29.6 per 100,000 in 1998. Suicides are more frequent in the central part of the country (the highest suicide rates was in Kirovohrad Oblast; In western Ukraine, the suicide rate was lower than the national average. Lviv Oblast has the lowest suicide rate - 5.3[65]
The Southern and eastern Ukrainian regions also suffer from the highest rates of HIV and AIDS, which impacts life expectancy. In late 2000, 60% of all AIDS cases in Ukraine were concentrated in the Odessa, Dnipropetrovsk, and Donetsk regions.[66] A major reason for this is the fact that the urbanized and industrialized regions in the East and South of Ukraine suffered most from the economic crisis in the 1990s, which in turn led to the spread of unemployment, alcoholism, and drug abuse, thus setting the conditions for wider spread of the epidemic.[67]
Regional differences in income
The western and central regions of Ukraine had lower GDP per capita than Kyiv and the industrialized eastern regions of Ukraine. In December 2019 the average monthly salary in Ukraine was 12,264 hryvnias (or 519 US dollars). Chernihiv oblast (northern Ukraine) and Kirovohrad Oblast (central Ukraine), had the lowest monthly salary of 8,851 and 9,450 hryvnias, respectively. In contrast, the monthly wage in the city of Kyiv was 18,869 hryvnias per month, and in Kyiv oblast – 13,259 per month.[68] In 2013, outside of the capital city of Kyiv, the wealthiest region was Donetsk Oblast with annual income 31,048 hryvnias. But as of 2017, Donetsk Oblast ranks as the second poorest after Luhansk Oblast with annual incomes 25,278 hryvnias and 16,416 hryvnias respectively. [69] Both are in the eastern Ukraine and have sustained direct losses as a consequence of military actions.
Ukraine recorded one of the sharpest declines in poverty of any transition economy in 2001-2016 years. The poverty rate, measured against an absolute poverty line (below $1.25 per day in dollars, based on World Bank) fell from a high of 32 percent in 2001 to 8 percent in 2005. In terms of poverty rates, the central and northern regions have the country's highest poverty rates - 10.0%. The western and southern regions - 9.1% and 9% respectively. Kyiv City had the lowest poverty rate - 1.4%.[70] Percent of population living under $5.50 a day was 19% in 2005 and dropped to 4.0 percent in 2018.[71][72]
Urbanization
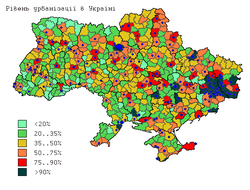
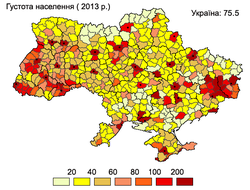
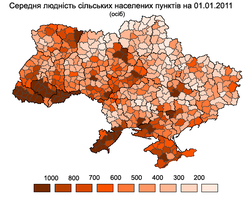
| Urbanization rate, 2011 | Population density, 2011 | Median population of rural settlements, 2011 |
Migration
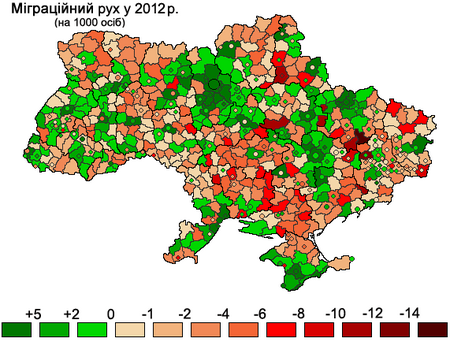
Emigration
Ukraine is the major source of migrants in Russia and many of the member states of the European Union. During the 1990s and early 2000s, Ukraine's sputtering economy and political instability contributed to rising emigration, especially to nearby Russia, Poland and Hungary, but also to other countries like Italy, Portugal, Spain, Turkey, Israel and Canada. Although estimates vary, approximately two to three million Ukrainian citizens are currently working abroad, most of them illegally, in construction, service, housekeeping, and agriculture industries. Eastern Ukrainians are likely to immigrate to Russia while western Ukrainians are likely to move to the E.U.[بحاجة لمصدر]
Between 1991 and 2004, the government counted 2,537,400 individuals who emigrated; 1,897,500 moved to other post-Soviet states, and 639,900 moved to other, mainly Western, states.[73]
By the early 2000s, Ukrainian embassies reported that 300,000 Ukrainian citizens were working in Poland, 200,000 in Italy, approximately 200,000 in the Czech Republic, 150,000 in Portugal, 100,000 in Spain, 35,000 in Turkey, 20,000 in the United States and small significant numbers in Austria, Belgium, France, Germany, Greece, Sweden, Switzerland and the UK. The largest number of Ukrainian workers abroad, about one million, are in the Russian Federation. Since 1992, 232,072 persons born in Ukraine have emigrated to the US.
From the point of view of the economic impact on natives, more appropriate than the absolute numbers is the volume of immigration as a proportion of the native population. Italy has the highest rate of Ukrainian emigrants as a proportion of the native population, while the much larger Russia has the largest absolute confirmed number of Ukrainian emigrants (leaving aside Poland Portugal and the Czech Republic, for which there is conflicting data).
Immigration
Between 1991 and 2003, about 100,000 illegal immigrants were detained at the western borders.[74] In 2005, about 5,000 illegal immigrants are detained yearly. Most of these are Asian immigrants from China, India, Pakistan and Afghanistan.[74] At the time about 3,000 officially registered refugees resided in Ukraine, of whom most were Afghans.[74]
Ukraine accepted some 62,000 refugees from Transnistria following its war in 1992.[74] Thousands were also accepted during decade from other post-Soviet conflicts in Abkhazia, Chechnya and Tajikistan.[74]
Results between the 1989 Soviet census and the 2001 census showed an increased number of CIS people in Ukraine from regions witnessing war. The number of Armenians in Ukraine almost doubled to 99,900 people during this period, while the number of Georgians and Azeris also had substantial increases.[74]
As of April 2020, 1.4 million Ukrainians are internally displaced due to the ongoing war in Donbas.[75]
See also
General:
References
- ^ أ ب "Population". www.ukrstat.gov.ua. State Statistics Service of Ukraine. Retrieved 2 January 2022.
- ^ أ ب ت ث ج ح "Population". www.ukrstat.gov.ua. State Statistics Service of Ukraine. Retrieved 2020-12-16.
- ^ أ ب ت ث ج ح خ د ذ "About number and composition population of Ukraine by data: All-Ukrainian census of the population 2001". State Statistics Committee of Ukraine. 2003. Archived from the original on 14 June 2007.
- ^ "Population census of Ukraine, 2001".
- ^ "All-Ukrainian population census". State Statistics Service of Ukraine. 2016. Retrieved 22 April 2016.
- ^ "Ukraine's Demographic Reality". Population Reference Bureau.
- ^ أ ب "Ukraine's Population Shrinks By Nearly A Quarter". Radio Free Europe. 23 January 2020. Retrieved 24 August 2020.
- ^ Ukraine, Orest Subtelny, page 152, 2000
- ^ "ru:Институт Национального исследовательского университета 'Высшая школа экономики'" [Institute of Demography of the National Research University "Graduate School of Economics']. Demoscope.ru (in الروسية). 21 March 2013. ISSN 1726-2887. Retrieved 10 December 2016.
- ^ Brief description of Zenon Kuzela (Kuzelya) (in إنگليزية)
- ^ Ukraine: A Concise Encyclopedia Vol. 1, Book by Volodymyr Kubiyovych; University of Toronto Press, 1963
- ^ "Posted availability of the book".
- ^ Ukrainian population census will be held in 2020 – Cabinet decree, Interfax-Ukraine (22 December 2015)
(in أوكرانية) In 2021, there will most likely be no all-Ukrainian census - Minister, hromadske.ua (21 April 2020) - ^ Vallin, Jacques; Meslé, France; Adamets, Serguei; Pyrozhkov, Serhii (2002). "A New Estimate of Ukrainian Population Losses During the Crises of the 1930s and 1940s". Population Studies. 56 (3): 249–264. doi:10.1080/00324720215934. JSTOR 3092980. PMID 12553326. S2CID 21128795.
- ^ Ian Dear, Michael Richard Daniell Foot (2001). The Oxford companion to World War II. Oxford University Press. p. 909. ISBN 0-19-860446-7
- ^ Malynovska, Olena (January 2006). "Caught Between East and West, Ukraine Struggles with Its Migration Policy". National Institute for International Security Problems, Kyiv. Retrieved 3 July 2008.
- ^ "United Nations Population Division | Department of Economic and Social Affairs". www.un.org (in الإنجليزية). Retrieved 2019-06-07.
- ^ "Ethnic origins, 2006 counts, for Canada, provinces and territories – 20% sample data". Statistics Canada.
- ^ Bershidsky, Leonid (20 February 2019). "Eastern Europe Feeds on a Shrinking Ukraine". Bloomberg. Retrieved 24 June 2019.
- ^ Kiryukhin, Denys (14 May 2019). "Losing Brains and Brawn: Outmigration from Ukraine". Woodrow Wilson International Center for Scholars. Retrieved 24 June 2019.
- ^ Tyshchuk, Tetyana (20 June 2018). "The Great Migration: No One in Ukraine Knows How Many of Our Compatriots Have Moved Abroad". vox ukraine. Retrieved 24 June 2019.
- ^ State Statistics Committee of Ukraine Retrieved 18 September 2009
- ^ Demoscope Retrieved 18 September 2009
- ^ "Field Listing – Population growth rate". CIA World Factbook. Retrieved 5 July 2008.
- ^ Hanna H. Starostenko, "Economic and Ecological Factors of Transformations in Demographic Process in Ukraine", Uktraine Magazine No. 2, 1998.
- ^ "What Went Wrong with Foreign Advice in Ukraine?". The World Bank Group. Archived from the original on 2009-07-20. Retrieved 16 January 2008.
- ^ "Infant mortality rate, Ukraine". Cia.gov. Retrieved 26 January 2014.
- ^ "The government has estimated Ukraine's population at 37.3 million". empr.media. Retrieved 2020-12-16.
- ^ Perelli-Harris, Brienna (2005). "The Path to Lowest-low Fertility in Ukraine". Population Studies. 59 (1): 55–70. doi:10.1080/0032472052000332700. JSTOR 30040436. PMID 15764134. S2CID 21769928.
- ^ أ ب The World FactBook - Ukraine, July 12, 2018, https://www.cia.gov/the-world-factbook/countries/ukraine/
- ^ "Bohdan Danylyshyn at the Economic ministry". Economic Ministry. Retrieved 1 February 2008.
- ^ "President meets with business bosses". Press office of President Victor Yushchenko. Archived from the original on 14 December 2007. Retrieved 1 February 2008.
- ^ (in أوكرانية) The demographic situation in Ukraine in January–September 2009, State Statistics Committee of Ukraine
- ^ "Ukraine's birth rate shows first positive signs in decade". Ukrainian Independent Information Agency (UNIAN). 5 October 2007. Retrieved 3 July 2008.
- ^ https://www.nas.gov.ua/EN/PersonalSite/Pages/default.aspx?PersonID=0000007165 Курило Ірина Олексіївна [Kurylo Iryna Oleksiivna]
- ^ https://www.nas.gov.ua/EN/Messages/Pages/View.aspx?MessageID=8021 The press service of the NAS of Ukraine, article "World Population Day: Is it possible to stop depopulation of Ukraine?" (in Ukrainian), translated quote: 'Iryna Kurylo stateted that Ukraine is breaking depopulation records: "...Currently, (as it was between years 1990 and 2000) Ukraine has lowest fertility rate in Europe: total fertility rate in Ukraine - 1.2 children [per woman], average in the EU countries - 1.56 children."'
- ^ "Statistical Yearbooks of the Russian Empire".
- ^ "The Crisis of the 1930s" (PDF).
- ^ أ ب "State Statistics Service of Ukraine".
- ^ "Table: 0301. Number of live births, deaths and natural increase (decrease) of the population (0,1)". Databank. State Statistics Service of Ukraine. Retrieved 9 July 2019.
- ^ Demographic yearbook, 2001 (PDF). New York: United Nations. 2003. ISBN 978-92-1-051094-3. Retrieved 22 April 2016.
- ^ Общий коэффициент смертности (на 1000 населения): Украина: 1950-2013 [Crude death rate (per 1,000 people): Ukraine: 1950-2013]. Demoscope Weekly (in الروسية). Archived from the original on 21 March 2016. Retrieved 22 April 2016.
- ^ Державна служба статистикі України [State Statistics Committee of Ukraine]. State Statistics Committee of Ukraine (in الأوكرانية). Archived from the original on 15 September 2002. Retrieved 14 December 2009.
- ^ "World Population Prospects - Population Division - United Nations". esa.un.org. Retrieved 2018-08-26.
- ^ "Населення та міграція 2016".
- ^ State Statistics Committee of Ukraine – Natural increase in population in 2010 Retrieved on 20 May 2011
- ^ Ukraine Population 2018, http://worldpopulationreview.com/countries/ukraine-population/
- ^ "State Statistics Committee of Ukraine – Population, as of 1 January 2013. Average annual populations 2012".
- ^ أ ب Population census 2001: Population by nationality Archived 15 مارس 2007 at the Wayback Machine
- ^ "Державна служба статистики України". www.ukrstat.gov.ua. Retrieved 2019-04-15.
- ^ "Phantom Syndrome: Ethnic Koreans in Ukraine". Bird In Flight (in الإنجليزية الأمريكية). 2017-07-18. Retrieved 2019-04-15.
- ^ "Ukraine PEOPLE 2017 SOURCE: 2017 CIA WORLD FACTBOOK AND OTHER SOURCES".
- ^ أ ب РЕЛІГІЯ, ЦЕРКВА, СУСПІЛЬСТВО І ДЕРЖАВА: ДВА РОКИ ПІСЛЯ МАЙДАНУ (Religion, Church, Society and State: Two Years after Maidan) Archived 22 أبريل 2017 at the Wayback Machine, 2016 report by Razumkov Center in collaboration with the All-Ukrainian Council of Churches. pp. 27-29.
- ^ "State Department of Ukraine on Religious". 2003 Statistical report. Archived from the original on 4 December 2004. Retrieved 27 January 2008.
- ^ About number and composition population of Autonomous Republic of Crimea by data All-Ukrainian population census Archived 4 ديسمبر 2007 at the Wayback Machine
- ^ Рождаемость в Украине самая низкая в Европе, Demoscope.ru, 16–29 April 2007 (in روسية)
- ^ United Nations Department of Economic and Social Affairs, Population Division (2007). "United Nations World Population Prospects: 2006 revision, Table A.15" (PDF). New York: UN. Retrieved 26 September 2010.
- ^ MIGnews: Volyn Region – Fertility Leader in Ukraine Archived 12 أكتوبر 2007 at the Wayback Machine, 10 October 2007. Retrieved 19 October 2007.
- ^ CIA world factbook.
- ^ أ ب Ukrainian News: Birth Rate Exceeds Death Rate in Five Regions of Ukraine First Since 1990s Archived 18 فبراير 2009 at the Wayback Machine 4 October 2007. Retrieved 19 October 2007.
- ^ Inna Filipenko. The Day. Births and deaths: A record-breaking half million children were born in Ukraine last year. #3. 3 February 2009. Retrieved 8 December 2009.
- ^ Natalia LEvchuk, Brienna Perelli-Harris. (2009). Declining Fertility in UKraine: What is the role of abortion and contraception? Max Planck Institute for Demographic Research
- ^ "World Bank Report, Chapter 3: Demographic Forecast Under the HIV/AIDS Epidemic" (PDF).
- ^ Unicef. (2004). The Situation of Children and Young People at the Regional Level in Ukraine Prepared by Ukraine Country Statistical Team Co-ordinator: Iryna Kalachova State Statistic Committee, Kyiv
- ^ [1].
- ^ The International Encyclopedia of Sexuality of the Kinsey Institute. Tamara V. Hovorun, Ph.D., and Borys M. Vornyk, Ph.D. (Medicine). Rewritten and updated in 2003 by T. V. Hovorun and B. M. Vornyk(2003) Ukraine Archived 23 يناير 2010 at the Wayback Machine.
- ^ Vulnerability Assessment of People Living With HIV (PLHIV) in Ukraine Archived 24 يوليو 2011 at the Wayback Machine United Nations Development Programme, page 24 – Retrieved on 8 December 2009
- ^ "Average Monthly Salary".
- ^ "Average Income in Ukraine Per Region, 2017 State Statistics Committee of Ukraine" (PDF).
- ^ "UKRAINE: Poverty Update" (PDF).
- ^ "Ukraine poverty rate".
- ^ "World Bank, Poverty & Equity and M acroeconomics, Trade & Investment Global Update-Spring-2019" (PDF).
- ^ By Olena Malynovska, National Institute for International Security Problems, Kyiv Caught Between East and West, Ukraine Struggles with Its Migration Policy
- ^ أ ب ت ث ج ح "Caught Between East and West, Ukraine Struggles with Its Migration Policy". Migration Policy Institute.
- ^ https://reliefweb.int/report/ukraine/national-monitoring-system-report-situation-internally-displaced-persons-march-2020
External links
- State Committee for Statistics of Ukraine, official website at the Library of Congress Web Archives (archived 2002-09-15)
- Trafficking in and enslavement of women Follow-up to the Fourth World Conference on Women, 2–13 March 1998
- Migration News, 2001 University of California, Davis
- The demographic situation in Ukraine: present state. tendencies, and predictions, Razumkov Centre
- On the status of observance and protection of the rights of Ukrainian citizens abroad the Special Report of the Ukrainian Parliament Commissioner for Human Rights
- News on Trafficking of Ukrainian Women, 2000-01 Trafficking in Women from Ukraine Research Project, University of Rhode Island
- Caught Between East and West, Ukraine Struggles with Its Migration Policy By Olena Malynovska, National Institute for International Security Problems, Kyiv, January 2006
- Emigration from Ukraine, 23 October 2003 The Economist (subscription required)
- Meslé, France; Pison, Gilles; Vallin, Jacques (2005). "France-Ukraine: Demographic Twins Separated by History" (PDF). Population and Societies (413): 1–4. Archived from the original (PDF) on 26 May 2011.
- Vallin, Jacques; Meslé, France; Adamets, Serguei; Pyrozhkov, Serhii (2002). "A New Estimate of Ukrainian Population Losses during the Crises of the 1930s and 1940s" (PDF). Population Studies. 56 (3): 249–264. doi:10.1080/00324720215934. PMID 12553326. S2CID 21128795.
- Mortality and Causes of Death in 20th-Century Ukraine [8]
- صفحات بها مخططات
- CS1 الروسية-language sources (ru)
- Articles with إنگليزية-language sources (en)
- Articles with أوكرانية-language sources (uk)
- CS1 uses الروسية-language script (ru)
- CS1 uses الأوكرانية-language script (uk)
- CS1 الأوكرانية-language sources (uk)
- CS1 الإنجليزية الأمريكية-language sources (en-us)
- Articles with روسية-language sources (ru)
- Short description is different from Wikidata
- Articles with hatnote templates targeting a nonexistent page
- Articles with unsourced statements from June 2014
- Articles with unsourced statements from December 2009
- Articles with unsourced statements from August 2015
- Webarchive template other archives
- Demographics of Ukraine
- ديموغرافيا أوكرانيا


