مقاطعة گلن، كاليفورنيا
(تم التحويل من Glenn County, California)
Glenn County, California | |
|---|---|
| County of Glenn | |
|
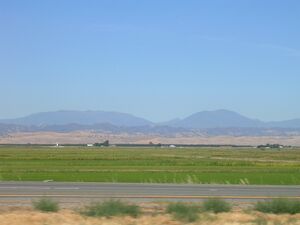
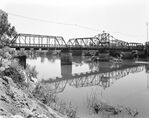
Images, from top down, left to right: A view from Interstate 5 in Glenn County, a scene in Willows, Gianella Bridge | |
 خريطة تفاعلية لمقاطعة گلن | |
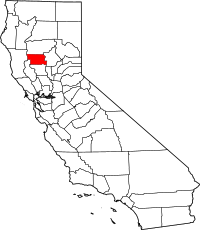
 الموقع في ولاية كاليفورنيا | |
| الإحداثيات: 39°35′N 122°23′W / 39.59°N 122.39°W | |
| البلد | الولايات المتحدة |
| الولاية | كاليفورنيا |
| المنطقة | وادي ساكرامنتو |
| Incorporated | 1891 |
| السمِيْ | Hugh J. Glenn |
| مقر المقاطعة | ويلوز |
| أكبر مدينة | أورلاند |
| المساحة | |
| • الإجمالي | 1٬327 ميل² (3٬440 كم²) |
| • البر | 1٬314 ميل² (3٬400 كم²) |
| • الماء | 13 ميل² (30 كم²) |
| أعلى منسوب | 7٬451 ft (2٬271 m) |
| التعداد | |
| • الإجمالي | 28٬122 |
| • Estimate (2019)[3] | 28٬393 |
| • الكثافة | 21/sq mi (8٫2/km2) |
| منطقة التوقيت | UTC−8 (Pacific Standard Time) |
| • الصيف (التوقيت الصيفي) | UTC−7 (Pacific Daylight Time) |
| Area code | 530 |
| FIPS code | 06-021 |
| GNIS feature ID | 277275 |
| الموقع الإلكتروني | Glenn County, California |
مقاطعة گلن إنگليزية: Glenn County هي إحدى مقاطعات ولاية كاليفورنيا في الولايات المتحدة.
الجغرافيا
According to the U.S. Census Bureau, the county has a total area of 1,327 square miles (3,440 km2), of which 1,314 square miles (3,400 km2) is land and 13 square miles (34 km2) (1.0%) is water.[4]
المقاطعات المجاورة
- Colusa County - south
- Lake County - southwest
- Mendocino County - west
- Tehama County - north
- Butte County - east
المناطق المحمية الوطنية
- Mendocino National Forest (part)
- Sacramento National Wildlife Refuge (part)
- Sacramento River National Wildlife Refuge (part)
الديمغرافيا
2011
| Population, race, and income | |||||
|---|---|---|---|---|---|
| Total population[5] | 28,027 | ||||
| White[5] | 21,943 | 78.3% | |||
| Black or African American[5] | 261 | 0.9% | |||
| American Indian or Alaska Native[5] | 768 | 2.7% | |||
| Asian[5] | 645 | 2.3% | |||
| Native Hawaiian or other Pacific Islander[5] | 9 | 0.0% | |||
| Some other race[5] | 3,460 | 12.3% | |||
| Two or more races[5] | 941 | 3.4% | |||
| Hispanic or Latino (of any race)[6] | 10,270 | 36.6% | |||
| Per capita income[7] | $21,254 | ||||
| Median household income[8] | $43,239 | ||||
| Median family income[9] | $51,067 | ||||
الأماكن حسب التعداد والعرق والدخل
| الأماكن حسب التعداد والعرق | ||||||||
|---|---|---|---|---|---|---|---|---|
| المكان | Type[10] | التعداد[5] | بيض[5] | Other[5] [note 1] |
آسيويون[5] | أمريكان سود أو أفارقة[5] |
Native American[5] [note 2] |
Hispanic or Latino (of any race)[6] |
| أرتوا | CDP | 189 | 87.8% | 12.2% | 0.0% | 0.0% | 0.0% | 12.2% |
| إلك كريك | CDP | 89 | 93.3% | 3.4% | 0.0% | 0.0% | 3.4% | 3.4% |
| هاملتون سيتي | CDP | 1,992 | 66.1% | 32.4% | 0.0% | 1.5% | 0.0% | 91.1% |
| أورلاند | مدينة | 7,214 | 79.6% | 18.0% | 1.1% | 0.1% | 1.2% | 43.2% |
| ويلوز | مدينة | 6,190 | 76.5% | 12.7% | 4.8% | 2.2% | 3.8% | 27.4% |
| الأماكن حسب التعداد والدخل | |||||
|---|---|---|---|---|---|
| المكان | Type[10] | Population[11] | Per capita income[7] | Median household income[8] | Median family income[9] |
| أرتوا | CDP | 189 | $27,344 | $70,288 | $70,288 |
| إلك كريك | CDP | 89 | $19,307 | $28,333 | $56,250 |
| هاملتون سيتي | CDP | 1,992 | $11,825 | $29,458 | $30,669 |
| أورلاند | مدينة | 7,214 | $17,372 | $45,186 | $51,577 |
| ويلوز | مدينة | 6,190 | $20,484 | $43,493 | $50,694 |
2010
| التعداد التاريخي | |||
|---|---|---|---|
| التعداد | Pop. | %± | |
| 1900 | 5٬150 | — | |
| 1910 | 7٬172 | 39٫3% | |
| 1920 | 11٬853 | 65٫3% | |
| 1930 | 10٬935 | −7٫7% | |
| 1940 | 12٬195 | 11٫5% | |
| 1950 | 15٬448 | 26٫7% | |
| 1960 | 17٬245 | 11٫6% | |
| 1970 | 17٬521 | 1٫6% | |
| 1980 | 21٬350 | 21٫9% | |
| 1990 | 24٬798 | 16٫1% | |
| 2000 | 26٬453 | 6٫7% | |
| 2010 | 28٬122 | 6٫3% | |
| 2019 (تق.) | 28٬393 | [3] | 1�0% |
| U.S. Decennial Census[12] 1790–1960[13] 1900–1990[14] 1990–2000[15] 2010–2015[2] | |||
السياسة
تسجيل الناخبين
| التعداد والناخبون المسجلون | ||
|---|---|---|
| Total population[5] | 28,027 | |
| Registered voters[16][note 3] | 12,266 | 43.8% |
| Democratic[16] | 3,761 | 30.7% |
| Republican[16] | 5,534 | 45.1% |
| -1,773 | -14.4% | |
| American Independent[16] | 461 | 3.8% |
| Green[16] | 41 | 0.3% |
| Libertarian[16] | 74 | 0.6% |
| Peace and Freedom[16] | 45 | 0.4% |
| Americans Elect[16] | 0 | 0.0% |
| Other[16] | 31 | 0.3% |
| No party preference[16] | 2,319 | 18.9% |
Cities by population and voter registration
| Cities by population and voter registration | |||||||
|---|---|---|---|---|---|---|---|
| City | Population[5] | Registered voters[16] [note 3] |
Democratic[16] | Republican[16] | D–R spread[16] | Other[16] | No party preference[16] |
| Orland | 7,214 | 40.6% | 33.5% | 40.3% | -6.8% | 8.2% | 21.3% |
| Willows | 6,190 | 40.4% | 32.0% | 41.4% | -9.4% | 10.6% | 20.4% |
Overview
Glenn is a strongly Republican county in Presidential and congressional elections. The last Democrat to win a majority in the county was Lyndon Johnson in 1964.
Presidential elections results
| Year | GOP | DEM | Others |
|---|---|---|---|
| 2020 | 62.5% 7,063 | 35.4% 3,995 | 2.1% 239 |
| 2016 | 61.12% 5,788 | 32.37% 3,065 | 6.52% 617 |
| 2012 | 60.97% 5,632 | 35.73% 3,301 | 3.30% 305 |
| 2008 | 59.82% 5,910 | 37.80% 3,734 | 2.38% 235 |
| 2004 | 66.72% 6,308 | 31.68% 2,995 | 1.60% 151 |
| 2000 | 66.53% 5,795 | 28.68% 2,498 | 4.80% 418 |
| 1996 | 56.86% 5,041 | 32.04% 2,841 | 11.10% 984 |
| 1992 | 43.24% 3,812 | 30.24% 2,666 | 26.52% 2,338 |
| 1988 | 62.06% 4,944 | 36.33% 2,894 | 1.61% 128 |
| 1984 | 69.74% 6,020 | 28.82% 2,488 | 1.44% 124 |
| 1980 | 64.80% 5,386 | 26.79% 2,227 | 8.41% 699 |
| 1976 | 52.67% 4,094 | 45.04% 3,501 | 2.29% 178 |
| 1972 | 59.01% 4,569 | 34.62% 2,681 | 6.37% 493 |
| 1968 | 53.91% 3,848 | 34.55% 2,466 | 11.54% 824 |
| 1964 | 45.97% 3,351 | 54.01% 3,937 | 0.03% 2 |
| 1960 | 53.17% 3,911 | 46.36% 3,410 | 0.48% 35 |
| 1956 | 51.96% 3,463 | 47.89% 3,192 | 0.15% 10 |
| 1952 | 64.45% 4,454 | 35.05% 2,422 | 0.51% 35 |
| 1948 | 50.99% 2,819 | 46.64% 2,578 | 2.37% 131 |
| 1944 | 49.32% 2,409 | 50.20% 2,452 | 0.47% 23 |
| 1940 | 43.92% 2,473 | 54.96% 3,095 | 1.12% 63 |
| 1936 | 32.50% 1,620 | 65.97% 3,288 | 1.52% 76 |
| 1932 | 31.34% 1,432 | 65.07% 2,973 | 3.59% 164 |
| 1928 | 65.03% 2,466 | 34.20% 1,297 | 0.76% 29 |
| 1924 | 44.84% 1,444 | 11.40% 367 | 43.75% 1,409 |
| 1920 | 64.19% 1,916 | 30.22% 902 | 5.59% 167 |
| 1916 | 40.23% 1,342 | 53.87% 1,797 | 5.91% 197 |
| 1912 | 0.45% 11 | 54.41% 1,325 | 45.14% 1,099 |
| 1908 | 44.72% 618 | 51.45% 711 | 3.84% 53 |
| 1904 | 50.03% 765 | 47.42% 725 | 2.55% 39 |
| 1900 | 39.49% 494 | 58.91% 737 | 1.60% 20 |
| 1896 | 36.54% 479 | 62.93% 825 | 0.53% 7 |
| 1892 | 33.78% 528 | 51.70% 808 | 14.53% 227 |
التجمعات
المدن
Census-designated places
Other communities
ترتيب التعداد
The population ranking of the following table is based on the 2010 census of Glenn County.[18]
† مقر المقاطعة
| الترتيب | City/Town/etc. | Municipal type | Population (2010 Census) |
|---|---|---|---|
| 1 | Orland | مدينة | 7,291 |
| 2 | † Willows | مدينة | 6,166 |
| 3 | Hamilton City | CDP | 1,759 |
| 4 | Artois | CDP | 295 |
| 5 | Grindstone Rancheria[19] | AIAN | 164 |
| 6 | Elk Creek | CDP | 163 |
انظر أيضاً
- Hiking trails in Glenn County
- National Register of Historic Places listings in Glenn County, California
- Orland Buttes
- Thomas D. Harp, mentions formation of the county
ملاحظات
الهامش
- ^ "Black Butte". Peakbagger.com. Retrieved April 8, 2015.
- ^ أ ب خطأ استشهاد: وسم
<ref>غير صحيح؛ لا نص تم توفيره للمراجع المسماةQF - ^ أ ب "Population and Housing Unit Estimates". Retrieved December 3, 2019.
- ^ "2010 Census Gazetteer Files". United States Census Bureau. August 22, 2012. Retrieved September 26, 2015.
- ^ أ ب ت ث ج ح خ د ذ ر ز س ش ص ض ط U.S. Census Bureau. American Community Survey, 2011 American Community Survey 5-Year Estimates, Table B02001. U.S. Census website . Retrieved October 26, 2013.
- ^ أ ب U.S. Census Bureau. American Community Survey, 2011 American Community Survey 5-Year Estimates, Table B03003. U.S. Census website . Retrieved October 26, 2013.
- ^ أ ب U.S. Census Bureau. American Community Survey, 2011 American Community Survey 5-Year Estimates, Table B19301. U.S. Census website . Retrieved October 21, 2013.
- ^ أ ب U.S. Census Bureau. American Community Survey, 2011 American Community Survey 5-Year Estimates, Table B19013. U.S. Census website . Retrieved October 21, 2013.
- ^ أ ب U.S. Census Bureau. American Community Survey, 2011 American Community Survey 5-Year Estimates, Table B19113. U.S. Census website . Retrieved October 21, 2013.
- ^ أ ب U.S. Census Bureau. American Community Survey, 2011 American Community Survey 5-Year Estimates. U.S. Census website . Retrieved October 21, 2013.
- ^ U.S. Census Bureau. American Community Survey, 2011 American Community Survey 5-Year Estimates, Table B01003. U.S. Census website . Retrieved October 21, 2013.
- ^ "U.S. Decennial Census". United States Census Bureau. Retrieved September 26, 2015.
- ^ "Historical Census Browser". University of Virginia Library. Retrieved September 26, 2015.
- ^ Forstall, Richard L., ed. (March 27, 1995). "Population of Counties by Decennial Census: 1900 to 1990". United States Census Bureau. Retrieved September 26, 2015.
- ^ "Census 2000 PHC-T-4. Ranking Tables for Counties: 1990 and 2000" (PDF). United States Census Bureau. April 2, 2001. Retrieved September 26, 2015.
- ^ أ ب ت ث ج ح خ د ذ ر ز س ش ص ض ط California Secretary of State. February 10, 2013 - Report of Registration Archived نوفمبر 3, 2013 at the Wayback Machine. Retrieved October 31, 2013.
- ^ Leip, David. "Dave Leip's Atlas of U.S. Presidential Elections". uselectionatlas.org. Retrieved March 18, 2018.
- ^ "2010 U.S. Census website". United States Census Bureau. Retrieved February 10, 2013.
- ^ Staff, Website Services & Coordination. "US Census Bureau 2010 Census Interactive Population Map". www.census.gov. Retrieved March 18, 2018.
وصلات خارجية
تصنيفات:
- Pages using gadget WikiMiniAtlas
- Short description is different from Wikidata
- Coordinates on Wikidata
- Articles containing إنگليزية-language text
- Pages using Lang-xx templates
- Pages using US Census population needing update
- Portal-inline template with redlinked portals
- Pages with empty portal template
- مقاطعة گلن، كاليفورنيا
- وادي ساكرامنتو
- تأسيسات 1891 في كاليفورنيا
- أماكن مأهولة تأسست في 1891
- مقاطعات كاليفورنيا
- صفحات مع الخرائط


