قائمة البلدان حسب انتاج النفط

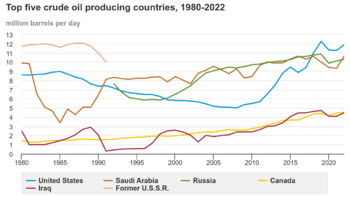
Top 5 oil-producing countries 1980–2022
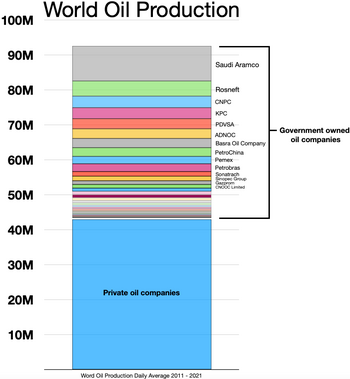
الانتاج العالمي من النفط

قائمة البلدان حسب انتاج النفط، بحسب قاعدة بيانات إدارة معلومات الطاقة الأمريكية لعام 2023، مع ترتيب البلدان بحسب أفضل تقدير قابل للمقارنة.

Compared with shorter-term data, the full-year figures are less prone to distortion from periodic maintenance shutdowns and other seasonal cycles.

The volumes in the table represent crude oil and lease condensate, the hydrocarbon liquids collected at or near the wellhead. The volumes in this table does not include biofuel, refinery gain (the increase in liquid volumes during oil refining), or liquids separated from natural gas in gas processing plants (natural gas liquids).[1] Production data including these other liquids is usually referred to as "Total Liquids Production", "Petroleum & Other Liquids", etc.[2]

Under this definition (crude and condensate), total world oil production in 2023 averaged 81,804,000 barrels per day. Approximately 72% of world oil production came from the top ten countries, and an overlapping 35% came from the twelve current OPEC members. Members of OPEC+, which includes current OPEC members produce about 60% of the world's petroleum.

In addition to being top 5 in oil production, the United States and Russia are also top 5 in oil exports, natural gas production and natural gas exports.

2023 marked the sixth straight that the United States led the world in oil production,[3] shale oil fracking has dramatically increased the country's oil output since 2010. The United States also became a net petroleum exporter in 2020, for the first time since at least 1949.[4] U.S. crude oil exports reached a record high in the first half of 2023.[5] U.S. oil production reached a record high in October 2023.[6]

. . . . . . . . . . . . . . . . . . . . . . . . . . . . . . . . . . . . . . . . . . . . . . . . . . . . . . . . . . . . . . . . . . . . . . . . . . . . . . . . . . . . . . . . . . . . . . . . . . . . . . . . . . . . . . . . . . . . . . . . . . . . . . . . . . . . . . . . . . . . . . . . . . . . . . . . . . . . . . . . . . . . . . . .

القائمة

Country Continent Oil production
December 2023
(bbl/day)
[1]
 الولايات المتحدة North America 13,295,000
 روسيا أوروپا/آسيا 10,126,000
 السعودية (OPEC) آسيا 8,950,000
 كندا North America 4,971,000
 العراق (OPEC) آسيا 4,375,000
 الصين آسيا 4,172,000
 إيران (OPEC) آسيا 4,084,000
 البرازيل South America 3,585,000
 الإمارات العربية المتحدة (OPEC) آسيا 3,300,000
 الكويت (OPEC) آسيا 2,644,000
 المكسيك North America 1,903,000
 قزخستان آسيا/أوروپا 1,897,000
 النرويج أوروپا 1,894,000
 نيجريا (OPEC) أفريقيا 1,573,000
 قطر آسيا 1,322,000
 ليبيا (OPEC) أفريقيا 1,248,000
 أنگولا أفريقيا 1,235,000
 الجزائر (OPEC) أفريقيا 1,160,000
 عُمان آسيا 1,040,000
 كولومبيا South America 787,000
 ڤنزويلا (OPEC) South America 770,000
 الأرجنتين South America 677,000
 المملكة المتحدة أوروپا 647,000
 إندونيسيا آسيا 605,000
 أذربيجان آسيا/أوروپا 601,000
 الهند آسيا 589,000
 مصر أفريقيا 559,000
 گويانا South America 555,000
 ماليزيا آسيا 525,000
 الإكوادور South America 486,000
 أستراليا Oceania 395,000
 الكونغو (OPEC) أفريقيا 253,000
 الگابون (OPEC) أفريقيا 220,000
 تركمنستان آسيا 191,000
 غانا أفريقيا 175,000
 البحرين آسيا 167,000
 ڤيتنام آسيا 165,000
 جنوب السودان أفريقيا 160,000
 تايلند آسيا 136,000
 تشاد أفريقيا 126,000
 إيطاليا أوروپا 119,000
 بروناي آسيا 100,000
 سوريا آسيا 95,000
 تركيا آسيا/أوروپا 89,000
 پاكستان آسيا 83,000
 غينيا الإستوائية (OPEC) أفريقيا 79,000
 السودان أفريقيا 71,000
 الدنمارك أوروپا 58,000
 رومانيا أوروپا 57,000
 ترنيداد وتوباگو South America 54,000
 الكاميرون أفريقيا 49,000
 پيرو South America 44,000
 تونس أفريقيا 33,000
 ألمانيا أوروپا 32,000
 اوزبكستان آسيا 32,000
 پاپوا غينيا الجديدة Oceania 31,000
 كوبا North America 30,000
 السنغال أفريقيا 30,000
 بلاروس أوروپا 29,000
 ساحل العاج أفريقيا 29,000
 هولندا أوروپا 28,000
 بوليڤيا South America 22,000
 المجر أوروپا 20,000
 الكونغو الديمقراطية أفريقيا 19,000
 پولندا أوروپا 18,000
 إسرائيل آسيا 15,000
 منغوليا آسيا 15,000
 اليمن آسيا 15,000
 ألبانيا أوروپا 14,000
 صربيا أوروپا 13,000
 سورينام South America 13,000
 فرنسا أوروپا 12,000
 نيوزيلندا Oceania 11,000
 كرواتيا أوروپا 10,000
 النمسا أوروپا 8,800
 ميانمار آسيا 7,100
 قيرغيزستان آسيا 6,200
 گواتيمالا North America 6,000
 النيجر أفريقيا 6,000
 تيمور الشرقية آسيا 5,000
 اليابان آسيا 3,500
 بنگلادش آسيا 3,000
 تشيلي South America 2,300
 اليونان أوروپا 1,500
 التشيك أوروپا 1,400
 بربادوس North America 1,000
 بلغاريا أوروپا 1,000
 جنوب أفريقيا أفريقيا 1,000
 الفلپين آسيا 900
 بليز North America 800
 لتوانيا أوروپا 700
 طاجيكستان آسيا 300
 جورجيا أوروپا/آسيا 200
 تايوان آسيا 200
 الأردن آسيا <100
 المغرب أفريقيا <100
 سلوڤاكيا أوروپا <100
 أرض الصومال أفريقيا <100
 إسپانيا أوروپا <100
World 82,922,000


انظر أيضاً

المصادر

  1. ^ أ ب "Crude Oil including Lease Condensate Monthly". U.S. Energy Information Administration (EIA). Retrieved 3 April 2024.
  2. ^ "Petroleum & Other Liquids". US Energy Information Administration.
  3. ^ "US leads global oil production for sixth straight year- EIA". Reuters. 5 March 2021. Retrieved 16 April 2024.
  4. ^ "Oil and petroleum products explained". Energy Information Administration. October 2, 2023.
  5. ^ "U.S. crude oil exports reached a record high in first half of 2023". Energy Information Administration. October 10, 2023.
  6. ^ Borenstein, Seth (October 20, 2023). "US oil production hits all-time high, conflicting with efforts to cut heat-trapping pollution". Associated Press News.