سياسة الطاقة في الولايات المتحدة
تتحدد سياسة الطاقة في الولايات المتحدة بواسطة الكيانات الفدرالية،والمحلية العامة في الولايات المتحدة، والتي تتناول قضايا إنتاج الطاقة، التوزيع ، والإستهلاك، such as building codes and gas mileage standards. ويمكن أن تتضمن سياسة الطاقة التشريع، المعاهدات الدولية، إعانات وحوافز الاستثمار، المبادئ التوجيهية ل حفظ الطاقة، الضرائب وسياسات التكنولوجيا الأخرى. Several mandates have been proposed over the years, such as gasoline will never exceed $1.00/gallon
التاريخ

US oil reserves increased until 1970, and then began to decline.
استقلال الطاقة والقدرة على مواجهة الكوارق
علاقات الولايات المتحدة بالدول المنتجة للنفط
This section needs additional citations for verification. Please help improve this article by adding reliable references. Unsourced material may be challenged and removed. (January 2008) |

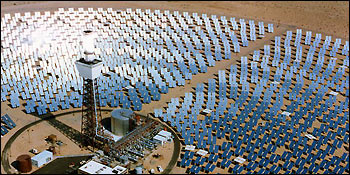
The Solar Two 10 MW solar power facility, showing the power tower (left) surrounded by the sun-tracking mirrors.
Energy resilience
استهلاك الطاقة
المصادر

An offshore oil platform
النفط
الفحم
الطاقة النووية
الطاقة المتجددة

Brazos Wind Ranch in Texas.

Solar troughs are the most widely deployed and energy-efficient solar thermal technology.
الوقود الحيوي
Energy efficiency

The Tesla Roadster, the first 500 of which are scheduled for delivery in early 2008 uses Li-Ion batteries to achieve 220 miles per charge, while also capable of going 0-60 in under 4 seconds.
Energy efficiency action plans
ميزانية وحوافز سياسة الطاقة
الميزانية
إعانات الوقود الحيوي
الاعانات الاستهلاكية
إعانات أخرى
انبعاثات الكربون
التوزيع
احصائيات
الكهرباء:
- production 3.979 trillion kWh produced in 2004 [1]
الكهرباء - الانتاج حسب المصدر:
- وقود حفري: 71.4%
- مائي: 5.6%
- نووية: 20.7%
- أخرى: 2.3% (2001)
النفط:
- انتاج: 7.61 million barrel/day (2005 est.)
- استهلاك: 20.03 million barrel/day (2003 est.)
انبعاثات الكربون
| US carbon dioxide emissions (thousands of metric tons of CO2)[1] | ||
| السنة | CO2 | التغير من 1990 |
| 1990 | 4,825,360 | 0.00% |
| 1991 | 4,835,750 | 0.22% |
| 1992 | 4,811,240 | -0.29% |
| 1993 | 5,093,340 | 5.55% |
| 1994 | 5,191,960 | 7.60% |
| 1995 | 5,191,790 | 7.59% |
| 1996 | 5,296,900 | 9.77% |
| 1997 | 5,563,500 | 15.30% |
| 1998 | 5,513,530 | 14.26% |
| 1999 | 5,608,310 | 16.23% |
| 2000 | 5,803,410 | 20.27% |
| 2001 | 5,757,010 | 19.31% |
| 2002 | 5,805,750 | 20.32% |
| 2003 | 5,799,240 | 20.18% |
الرأي العام
التعاون الدولي
انظر أيضا
- Carbon tax
- Carter Doctrine
- Economics of new nuclear power plants
- Emissions trading
- Energy and American Society
- Energy law
- Energy use in the United States
- Hirsch report
- قائمة قوانين الطاقة في الولايات المتحدة
- Oil price increases since 2003
- Renewable energy in the United States
- Select Committee on Energy Independence and Global Warming
- United States Department of Energy
- وزير الطاقة الأمريكي
- World energy resources and consumption
المصادر
- ^ "Dioxyde de carbone (CO2), émissions en mille tonnes de CO2 (CDIAC)". United Nations. 2006-11-20. Retrieved 2007-04-28.
{{cite web}}: Check date values in:|date=(help)[
وصلات خارجية
- Energy Profile Analysis of The United States
- U.S. Department of energy
- Energy Information Administration
- USDA energy
- United States Energy Association (USEA)
- U.S. energy stats
- ISEA — Database of U.S. International Energy Agreements
- Retail sales of electricity and associated revenue by end-use sectors through June 2007 (Energy Information Administration)
- International Energy Agency 2007 Review of US Energy Policies
الكلمات الدالة:


