أوترخت (مدينة)
أوترخت
Utrecht | |
|---|---|
|
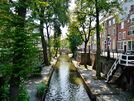
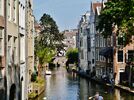
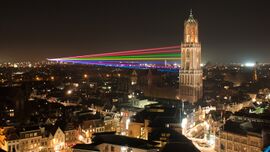
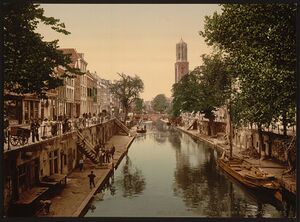
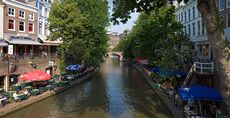
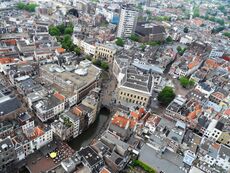
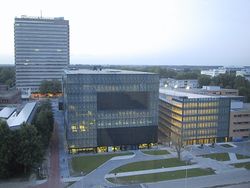
Photographs of the city, with the برج دوم في St. Martin's Cathedral in the centre | |
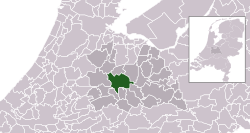 موقع أوترخت في هولندا | |
| الإحداثيات: 52°5′N 5°7′E / 52.083°N 5.117°E | |
| البلد | هولندا |
| المقاطعة | أوترخت |
| الحكومة | |
| • الكيان | Municipal council |
| • العمدة | شارون ديكسما (PvdA) |
| المساحة | |
| • Municipality | 99٫21 كم² (38٫31 ميل²) |
| • البر | 94٫33 كم² (36٫42 ميل²) |
| • الماء | 4٫88 كم² (1٫88 ميل²) |
| • Randstad | 3٬043 كم² (1٬175 ميل²) |
| المنسوب | 5 m (16 ft) |
| التعداد | |
| • Municipality | 358٬454 |
| • الكثافة | 3٬658/km2 (9٬470/sq mi) |
| • Urban | 489٬734 |
| • العمرانية | 656٬342 |
| • Randstad | 6٬979٬500 |
| صفة المواطن | Utrechter(s) [nb 1] |
| منطقة التوقيت | UTC+1 (CET) |
| • الصيف (التوقيت الصيفي) | UTC+2 (CEST) |
| Postcode | 3450–3455, 3500–3585 |
| Area code | 030 |
| الموقع الإلكتروني | www |
اوترخت Utrecht مدينة وبلدية وعاصمة وأكبر مدن مقاطعة اوترخت. وتقع في شمال شرق راندستاد، وهي رابع أكبر مدن هولندا، بتعداد 300,030 عام 2007.[6] تجمع اوترخت الصغرى، الذي يضم الضواحي المحيطة والبلدات الملحقة بها، يبلغ تعداد سكانه 640,000 ساكناً مسجلاً، بينما المنطقة الكبرى تحتوي على 820,000 نسمة.[7]
Utrecht's ancient city centre features many buildings and structures, several dating as far back as the High Middle Ages. It has been the religious centre of the Netherlands since the 8th century. It lost the status of prince-bishopric but remains the main religious centre in the country. Utrecht was the most important city in the Netherlands until the Dutch Golden Age, when it was surpassed by Amsterdam as the country's cultural centre and most populous city.
Utrecht is host to Utrecht University, the largest university in the Netherlands, as well as several other institutions of higher education. Due to its central position within the country, it is an important transport hub for both rail and road transport; the busiest train station in the Netherlands, Utrecht Centraal, is in the city of Utrecht. It has the second highest number of cultural events in the Netherlands, after Amsterdam.[8] In 2012, Lonely Planet included Utrecht in the top 10 of the world's unsung places.[9]
. . . . . . . . . . . . . . . . . . . . . . . . . . . . . . . . . . . . . . . . . . . . . . . . . . . . . . . . . . . . . . . . . . . . . . . . . . . . . . . . . . . . . . . . . . . . . . . . . . . . . . . . . . . . . . . . . . . . . . . . . . . . . . . . . . . . . . . . . . . . . . . . . . . . . . . . . . . . . . . . . . . . . . . .
التاريخ
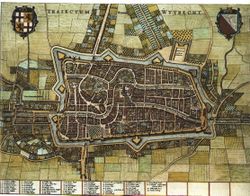
Although there is some evidence of earlier inhabitation in the region of Utrecht, dating back to the Stone Age (app. 2200 BCE) and settling in the Bronze Age (app. 1800–800 BCE),[10] the founding date of the city is usually related to the construction of a Roman fortification (castellum), probably built in around 50 CE. A series of such fortresses was built after the Roman emperor Claudius decided the empire should not expand further north. To consolidate the border, the Limes Germanicus defense line was constructed[11] along the main branch of the river Rhine, which at that time flowed through a more northern bed (now known as the Kromme Rijn) compared to today's Rhine flow. These fortresses were designed to house a cohort of about 500 Roman soldiers. Near the fort, settlements would grow housing artisans, traders and soldiers' wives and children.
مركز المسيحية في هولندا (650–1579)

الجغرافيا
المناخ
Utrecht experiences a temperate oceanic climate (Köppen: Cfb) مماثل لكل هولندا.
| Climate data for دى بيلت | |||||||||||||
|---|---|---|---|---|---|---|---|---|---|---|---|---|---|
| Month | Jan | Feb | Mar | Apr | May | Jun | Jul | Aug | Sep | Oct | Nov | Dec | Year |
| Record high °C (°F) | 15.1 (59.2) |
18.9 (66.0) |
23.9 (75.0) |
28.9 (84.0) |
33.6 (92.5) |
36.8 (98.2) |
37.5 (99.5) |
35.3 (95.5) |
34.2 (93.6) |
26.7 (80.1) |
18.7 (65.7) |
15.3 (59.5) |
37.5 (99.5) |
| Mean daily maximum °C (°F) | 5.6 (42.1) |
6.4 (43.5) |
10.0 (50.0) |
14.0 (57.2) |
18.0 (64.4) |
20.4 (68.7) |
22.8 (73.0) |
22.6 (72.7) |
19.1 (66.4) |
14.6 (58.3) |
9.6 (49.3) |
6.1 (43.0) |
14.1 (57.4) |
| Daily mean °C (°F) | 3.1 (37.6) |
3.3 (37.9) |
6.2 (43.2) |
9.2 (48.6) |
13.1 (55.6) |
15.6 (60.1) |
17.9 (64.2) |
17.5 (63.5) |
14.5 (58.1) |
10.7 (51.3) |
6.7 (44.1) |
3.7 (38.7) |
10.1 (50.2) |
| Mean daily minimum °C (°F) | 0.3 (32.5) |
0.2 (32.4) |
2.3 (36.1) |
4.1 (39.4) |
7.8 (46.0) |
10.5 (50.9) |
12.8 (55.0) |
12.3 (54.1) |
9.9 (49.8) |
6.9 (44.4) |
3.6 (38.5) |
1.0 (33.8) |
6.0 (42.8) |
| Record low °C (°F) | −24.8 (−12.6) |
−21.6 (−6.9) |
−14.4 (6.1) |
−6.6 (20.1) |
−3.7 (25.3) |
0.2 (32.4) |
3.2 (37.8) |
3.8 (38.8) |
−0.7 (30.7) |
−7.8 (18.0) |
−14.4 (6.1) |
−16.6 (2.1) |
−24.8 (−12.6) |
| Average precipitation mm (inches) | 69.6 (2.74) |
55.8 (2.20) |
66.8 (2.63) |
42.3 (1.67) |
61.9 (2.44) |
65.6 (2.58) |
81.1 (3.19) |
72.9 (2.87) |
78.1 (3.07) |
82.8 (3.26) |
79.8 (3.14) |
75.8 (2.98) |
832.5 (32.78) |
| Average precipitation days (≥ 1 mm) | 12 | 10 | 11 | 9 | 10 | 10 | 10 | 10 | 11 | 12 | 13 | 12 | 131 |
| Average snowy days | 6 | 6 | 4 | 2 | 0 | 0 | 0 | 0 | 0 | 0 | 2 | 5 | 25 |
| Average relative humidity (%) | 87 | 84 | 81 | 75 | 75 | 76 | 77 | 79 | 84 | 86 | 89 | 89 | 82 |
| Mean monthly sunshine hours | 62.3 | 85.7 | 121.6 | 173.6 | 207.2 | 193.9 | 206.0 | 187.7 | 138.3 | 112.9 | 63.0 | 49.3 | 1٬601٫6 |
| Source 1: Royal Netherlands Meteorological Institute (1981–2010 normals, snowy days normals for 1971–2000)[12] | |||||||||||||
| Source 2: Royal Netherlands Meteorological Institute (1901–present extremes)[13] | |||||||||||||
السكان
الديمغرافيا
|
|
| ||||||||||||||||||||||||||||||||||||||||||||||||||||||||||||||||||||||||
| Source: Lourens & Lucassen 1997, pp. 87–88 (1400–1795) | ||||||||||||||||||||||||||||||||||||||||||||||||||||||||||||||||||||||||||
| تعداد اوترخت[14] | ||||
| Female | Age | Male | ||
|---|---|---|---|---|
| 22761 | 15% | 0-14 | 23994 | 17% |
| 44732 | 30% | 15-29 | 36165 | 26% |
| 36444 | 24% | 30-44 | 39434 | 28% |
| 15574 | 10% | 45-54 | 15996 | 11% |
| 11899 | 8% | 55-64 | 11484 | 8% |
| 8317 | 6% | 65-74 | 7457 | 5% |
| 9374 | 6% | 74+ | 4764 | 3% |
. . . . . . . . . . . . . . . . . . . . . . . . . . . . . . . . . . . . . . . . . . . . . . . . . . . . . . . . . . . . . . . . . . . . . . . . . . . . . . . . . . . . . . . . . . . . . . . . . . . . . . . . . . . . . . . . . . . . . . . . . . . . . . . . . . . . . . . . . . . . . . . . . . . . . . . . . . . . . . . . . . . . . . . .
الدين
Religions in Utrecht (2013)[15]
أفق المدينة

التعليم
الثقافة
أعلام من أوترخت
- البابا أدريان السادس (1459-1523) - رأس الكنيسة الكاثوليكية
- C.H.D. Buys Ballot (1817-1890) - meteorologist (Buys-Ballot's law)
- ثيو ڤان دوسبورگ (1883-1931) - painter, artist (حركة ده ستيل)
- گريت ريتڤلد (1888-1964) - designer, architect (حركة ده ستيل)
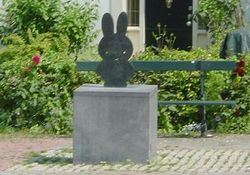
- ديك برونا (1923- ) - writer, illustrator (ميفي)
المدن الشقيقة
لاوترخت اتفاقيات توأمة مدن مع المدن التالية:
 ليون، نيكاراگوا
 برنو, جمهورية التشيك
 كنشاسا, جمهورية الكونغو الديمقراطية
- سابقاً
 هانوڤر، ألمانيا, بين 1970 و 1976
. . . . . . . . . . . . . . . . . . . . . . . . . . . . . . . . . . . . . . . . . . . . . . . . . . . . . . . . . . . . . . . . . . . . . . . . . . . . . . . . . . . . . . . . . . . . . . . . . . . . . . . . . . . . . . . . . . . . . . . . . . . . . . . . . . . . . . . . . . . . . . . . . . . . . . . . . . . . . . . . . . . . . . . .
ملاحظات
- ^ See Utrecht sodomy trials § Legacy for the history of these demonyms.
الهامش
- ^ "Burgemeester" [العمدة] (in الهولندية). Gemeente Utrecht. Archived from the original on 7 April 2014. Retrieved 3 April 2014.
- ^ أ ب قالب:Cite techreport
- ^ "Postcodetool for 3512GG". Actueel Hoogtebestand Nederland (in الهولندية). Het Waterschapshuis. Retrieved 3 April 2014.
- ^ "Bevolkingsontwikkeling; regio per maand" [Population growth; regions per month]. CBS Statline (in Dutch). CBS. 27 October 2017. Retrieved 27 October 2017.
{{cite web}}: CS1 maint: unrecognized language (link) - ^ "Bevolkingsontwikkeling; regio per maand". CBS Statline (in Dutch). CBS. 26 June 2014. Retrieved 24 July 2014.
{{cite web}}: Unknown parameter|trans_title=ignored (|trans-title=suggested) (help)CS1 maint: unrecognized language (link) - ^ Staatscourant (2007). "Kerngegevens gemeente Utrecht". Retrieved 2008-01-05.
- ^ CBS statline (2007). "Gemiddelde bevolking per regio naar leeftijd en geslacht / Gebieden in Nederland 2007". Retrieved 2008-01-05.
- ^ Gemeente Utrecht. "Utrecht Monitor 2007" (PDF) (in الهولندية). Retrieved 6 January 2008.
- ^ Planet, Lonely (2012-05-14). "10 of the world's unsung places". Lonely Planet (in الإنجليزية). Retrieved 2017-08-06.
- ^ "Gemeente Utrecht, Geschiedenis Utrecht voor 1528".
- ^ de Bruin, R.E.; Hoekstra, T.J.; Pietersma, A. (1999). Twintig eeuwen Utrecht, korte geschiedenis van de stad (in الهولندية). Utrecht: SPOU & Het Utrechts Archief. ISBN 90-5479-040-7.
- ^ "Klimaattabel De Bilt, langjarige gemiddelden, tijdvak 1981–2010" (PDF) (in الهولندية). Royal Netherlands Meteorological Institute. Retrieved 9 September 2013.
- ^ "Maandrecords De Bilt" (in الهولندية). Royal Netherlands Meteorological Institute. Retrieved 9 May 2016.
- ^ خطأ استشهاد: وسم
<ref>غير صحيح؛ لا نص تم توفيره للمراجع المسماةbevolkingutrecht - ^ "Kerkelijkheid en kerkbezoek, 2010/2013". Centraal Bureau voor de Statistiek.
ببليوگرافيا
- Lourens, Piet; Lucassen, Jan (1997). Inwonertallen van Nederlandse steden ca. 1300–1800. Amsterdam: NEHA. ISBN 9057420082.
انظر أيضاً
وصلات خارجية
- Official website of the city
- Official website of the city (in English)
- Mobile website of the city
- CU 2030, redevelopment of the Utrecht Central railroad station area (Dutch only)
الخرائط
- Pages using gadget WikiMiniAtlas
- CS1 الهولندية-language sources (nl)
- CS1 errors: unsupported parameter
- Short description is different from Wikidata
- Coordinates on Wikidata
- Articles with hatnote templates targeting a nonexistent page
- اوترخت (مدينة)
- بلديات مقاطعة اوترخت
- مدن هولندا
- مستوطنات على الراين
- تأسيسات عقد 40
- مستوطنات تأسست في القرن الأول
