أكروگ خانتي-مانسي الذاتي
خانتي-مانسي الأكروگ الذاتي-يوگرا | |
|---|---|
| Ханты-Мансийский автономный округ — Югра | |
 | |
| النشيد: Anthem of Khanty-Mansi Autonomous Okrug | |
 | |
| الإحداثيات: 62°15′N 70°10′E / 62.250°N 70.167°E | |
| البلد | روسيا |
| المنطقة الاتحادية | الأورال[1] |
| المنطقة الاقتصادية | غرب سيبيريا[2] |
| تأسست | December 10, 1930 |
| المركز الإداري | خانتي-مانسيسك |
| الحكومة | |
| • الكيان | Duma |
| • Governor | Natalya Komarova[3] |
| المساحة | |
| • Total | 534٬800 كم² (206٬500 ميل²) |
| ترتيب المساحة | 9th |
| التعداد (2010 Census)[5] | |
| • Total | 1٬532٬243 |
| • الترتيب | 29th |
| • الكثافة | 2٫9/km2 (7٫4/sq mi) |
| • Urban | 91٫5% |
| • الريف | 8٫5% |
| منطقة التوقيت | UTC+5 (توقيت يكاترينبورغ |
| ISO 3166 code | RU-KHM |
| لوحات السيارات | 86, 186 |
| OKTMO ID | 71800000 |
| اللغات الرسمية | الروسية[7] |
| الموقع الإلكتروني | http://www.admhmao.ru/ |
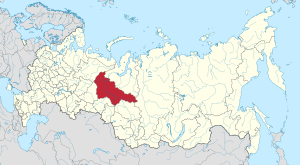
خانتي-مانسي الأكروگ الذاتي-يوگرا Khanty-Mansi Autonomous Okrug—Yugra (بالروسية: Ха́нты-Манси́йский автоно́мный о́круг — Югра́}}، وتـُنطق: Khanty-Mansiysky avtonomny okrug – Yugra)، أو خانتيا-مانسيا، هي كيان فدرالي في روسيا (اُكروگ مستقل ذاتياً في اُبلاست تيومن). السكان الأصليون للمنطقة هم الخانتي والمانسي, اللذان يـُعرفان معاً باسم شعب أوگريو اُب، ذو اللغات الأقرب إلى المجرية.
. . . . . . . . . . . . . . . . . . . . . . . . . . . . . . . . . . . . . . . . . . . . . . . . . . . . . . . . . . . . . . . . . . . . . . . . . . . . . . . . . . . . . . . . . . . . . . . . . . . . . . . . . . . . . . . . . . . . . . . . . . . . . . . . . . . . . . . . . . . . . . . . . . . . . . . . . . . . . . . . . . . . . . . .
الجغرافيا
الأنهار الرئيسية في هذه المنطقة هي نهر اُب ورافده إرتيش.
منطقة التوقيت
وتقع خانتيا-مانسيا في منطقة توقيت يكاترينبورگ (YEKT/YEKST). UTC offset is +0500 (YEKT)/+0600 (YEKST).
الأقسام الإدارية
السكان
التجمعات
أكبر المدن أو البلدات في Khanty-Mansi Autonomous Okrug
التعداد الروسي 2010 | |||||||||
|---|---|---|---|---|---|---|---|---|---|
| الترتيب | التقسيمات الادارية | التعداد | |||||||
 سورگوت  نژنىڤارتوڤسك |
1 | سورگوت | City of okrug significance of Surgut | 380,632 | |||||
| 2 | نژنىڤارتوڤسك | City of okrug significance of Nizhnevartovsk | 277,668 | ||||||
| 3 | نفتىيوگانسك | City of okrug significance of Nefteyugansk | 127,255 | ||||||
| 4 | خانتي-مانسيسك | Town of okrug significance of Khanty-Mansiysk | 101,466 | ||||||
| 5 | كوگاليم | Town of okrug significance of Kogalym | 67,727 | ||||||
| 6 | Nyagan | Town of okrug significance of Nyagan | 58,565 | ||||||
| 7 | Megion | Town of okrug significance of Megion | 46,643 | ||||||
| 8 | لانگيپاس | Town of okrug significance of Langepas | 44,646 | ||||||
| 9 | رادوژني | Town of okrug significance of Raduzhny | 43,666 | ||||||
| 10 | پيت-ياخ | Town of okrug significance of Pyt-Yakh | 39,570 | ||||||
الجماعات العرقية
The indigenous population (Khanty, Mansi, and Nenets) is only 2.2% of the total population in the Khanty-Mansi Autonomous Okrug. The exploitation of natural gas in Khanty-Mansi Autonomous Okrug has attracted immigrants from all over the former Soviet Union. The 2010 Census counted twenty-five ethnic groups of more than two thousand persons each. The ethnic composition is as follows:
Population of Khanty-Mansi Autonomous Okrug:[8]
| الجماعة العرقية | % |
|---|---|
| Russian | 68.1% |
| Tatar | 7.6% |
| Ukrainian | 6.4% |
| Bashkir | 2.5% |
| Azeri | 1.8% |
| Khanty | 1.3% |
| Belarusians | 1% |
| Kumyk | 1% |
| Chuvash | 0.9% |
| Lezgin | 0.9% |
| Mansi | 0.8% |
| Moldovan | 0.7% |
| أوزبك | 0.7% |
| Chechen | 0.5% |
| German | 0.5% |
| أرمن | 0.4% |
| Other | 5.9% |
Historical population figures are shown below:
| الجماعة العرقية |
تعداد 1939 | تعداد 1959 | تعداد 1970 | تعداد 1979 | تعداد 1989 | تعداد 2002 | تعداد 2010 1 | |||||||||
|---|---|---|---|---|---|---|---|---|---|---|---|---|---|---|---|---|
| Number | % | Number | % | Number | % | Number | % | Number | % | Number | % | Number | % | |||
| خانتي | 12,238 | 13.1% | 11,435 | 9.2% | 12,222 | 4.5% | 11,219 | 2.0% | 11,892 | 0.9% | 17,128 | 1.2% | 19,068 | 1.3% | ||
| مانسي | 5,768 | 6.2% | 5,644 | 4.6% | 6,684 | 2.5% | 6,156 | 1.1% | 6,562 | 0.5% | 9,894 | 0.7% | 10,977 | 0.8% | ||
| ننتس | 852 | 0.9% | 815 | 0.7% | 940 | 0.3% | 1,003 | 0.2% | 1,144 | 0.1% | 1,290 | 0.1% | 1,438 | 0.1% | ||
| Komi | 2,436 | 2.6% | 2,803 | 2.3% | 3,150 | 1.2% | 3,105 | 0.5% | 3,000 | 0.2% | 3,081 | 0.2% | 2,364 | 0.2% | ||
| روس | 67,616 | 72.5% | 89,813 | 72.5% | 208,500 | 76.9% | 423,792 | 74.3% | 850,297 | 66.3% | 946,590 | 66.1% | 973,978 | 68.1% | ||
| أوكران | 1,111 | 1.2% | 4,363 | 3.5% | 9,986 | 3.7% | 45,484 | 8.0% | 148,317 | 11.6% | 123,238 | 8.6% | 91,323 | 6.4% | ||
| Tatars | 2,227 | 2.4% | 2,938 | 2.4% | 14,046 | 5.2% | 36,898 | 6.5% | 97,689 | 7.6% | 107,637 | 7.5% | 108,899 | 7.6% | ||
| غيرهم | 1,026 | 1.1% | 6,115 | 4.9% | 15,629 | 5.8% | 43,106 | 7.6% | 163,495 | 12.7% | 223,959 | 15.6% | 173,536 | 12.6% | ||
| 1 102,138 people were registered from administrative databases, and could not declare an ethnicity. It is estimated that the proportion of ethnicities in this group is the same as that of the declared group.[9] | ||||||||||||||||
إحصائيات حيوية
| Average population (x 1000) | Live births | Deaths | Natural change | Crude birth rate (per 1000) | Crude death rate (per 1000) | Natural change (per 1000) | Fertility rates | |
|---|---|---|---|---|---|---|---|---|
| 1970 | 281 | 5 959 | 2 025 | 3 934 | 21.2 | 7.2 | 14.0 | |
| 1975 | 415 | 9 450 | 2 572 | 6 878 | 22.8 | 6.2 | 16.6 | |
| 1980 | 649 | 13 901 | 4 116 | 9 785 | 21.4 | 6.3 | 15.1 | |
| 1985 | 1 041 | 25 130 | 4 863 | 20 267 | 24.1 | 4.7 | 19.5 | |
| 1990 | 1 274 | 21 812 | 5 354 | 16 458 | 17.1 | 4.2 | 12.9 | |
| 1991 | 1 276 | 19 060 | 5 884 | 13 176 | 14.9 | 4.6 | 10.3 | |
| 1992 | 1 270 | 15 849 | 7 132 | 8 717 | 12.5 | 5.6 | 6.9 | |
| 1993 | 1 274 | 14 531 | 9 401 | 5 130 | 11.4 | 7.4 | 4.0 | 1,59 |
| 1994 | 1 286 | 15 120 | 9 937 | 5 183 | 11.8 | 7.7 | 4.0 | 1,59 |
| 1995 | 1 298 | 14 418 | 10 041 | 4 377 | 11.1 | 7.7 | 3.4 | 1,46 |
| 1996 | 1 310 | 14 469 | 9 508 | 4 961 | 11.0 | 7.3 | 3.8 | 1,39 |
| 1997 | 1 330 | 14 640 | 8 497 | 6 143 | 11.0 | 6.4 | 4.6 | 1,34 |
| 1998 | 1 351 | 15 600 | 8 164 | 7 436 | 11.5 | 6.0 | 5.5 | 1,39 |
| 1999 | 1 359 | 14 728 | 8 476 | 6 252 | 10.8 | 6.2 | 4.6 | 1,29 |
| 2000 | 1 372 | 15 579 | 9 426 | 6 153 | 11.4 | 6.9 | 4.5 | 1,34 |
| 2001 | 1 398 | 17 130 | 9 863 | 7 267 | 12.3 | 7.1 | 5.2 | 1,43 |
| 2002 | 1 426 | 19 051 | 9 829 | 9 222 | 13.4 | 6.9 | 6.5 | 1,54 |
| 2003 | 1 445 | 19 883 | 10 000 | 9 883 | 13.8 | 6.9 | 6.8 | 1,58 |
| 2004 | 1 456 | 20 377 | 9 828 | 10 549 | 14.0 | 6.8 | 7.2 | 1,59 |
| 2005 | 1 466 | 19 958 | 10 415 | 9 543 | 13.6 | 7.1 | 6.5 | 1,54 |
| 2006 | 1 476 | 20 366 | 10 077 | 10 289 | 13.8 | 6.8 | 7.0 | 1,56 |
| 2007 | 1 487 | 21 887 | 10 093 | 11 794 | 14.7 | 6.8 | 7.9 | 1,66 |
| 2008 | 1 500 | 23 197 | 10 215 | 12 982 | 15.5 | 6.8 | 8.7 | 1,74 |
| 2009 | 1 513 | 23 840 | 10 107 | 13 733 | 15.8 | 6.7 | 9.1 | 1,77 |
| 2010 | 1 527 | 25 089 | 10 447 | 14 642 | 16.4 | 6.8 | 9.6 | 1,84 |
| 2011 | 1 543 | 25 335 | 10 072 | 14 642 | 16.4 | 6.5 | 9.9 | 1,86 |
| 2012 | 1 558 | 27 686 | 9 949 | 17 737 | 17.6 | 6.3 | 11.3 | 2,02 |
. . . . . . . . . . . . . . . . . . . . . . . . . . . . . . . . . . . . . . . . . . . . . . . . . . . . . . . . . . . . . . . . . . . . . . . . . . . . . . . . . . . . . . . . . . . . . . . . . . . . . . . . . . . . . . . . . . . . . . . . . . . . . . . . . . . . . . . . . . . . . . . . . . . . . . . . . . . . . . . . . . . . . . . .
الدين

النقل
In the Khanty-Mansi Autonomous Okrug primary transport of goods accounted for water and railway transport, 29% is transported by road, and 2% aviation. The total length of railway tracks 1106 km. The length of roads, more than 18000.
المصادر
- ^ Президент Российской Федерации. Указ №849 от 13 мая 2000 г. «О полномочном представителе Президента Российской Федерации в федеральном округе». (President of the Russian Federation. Decree #849 of May 13, 2000 On the Plenipotentiary Representative of the President of the Russian Federation in a Federal District).
- ^ Госстандарт Российской Федерации. №ОК 024-95 27 декабря 1995 г. «Общероссийский классификатор экономических регионов. 2. Экономические районы», в ред. Изменения №5/2001 ОКЭР. (گوستاندارت of the Russian Federation. #OK 024-95 December 27, 1995 Russian Classification of Economic Regions. 2. Economic Regions, as amended by the Amendment #5/2001 OKER).
- ^ Official website of Khanty-Mansi Autonomous Okrug. Natalya Vladimirovna Komarova, Governor of Khanty-Mansi Autonomous Okrug Archived مارس 21, 2011 at the Wayback Machine (in روسية)
- ^ Федеральная служба государственной статистики (Federal State Statistics Service) (2004-05-21). "Территория, число районов, населённых пунктов и сельских администраций по субъектам Российской Федерации (Territory, Number of Districts, Inhabited Localities, and Rural Administration by Federal Subjects of the Russian Federation)". Всероссийская перепись населения 2002 года (All-Russia Population Census of 2002) (in الروسية). Federal State Statistics Service. Retrieved 2011-11-01.
- ^ خطأ استشهاد: وسم
<ref>غير صحيح؛ لا نص تم توفيره للمراجع المسماة2010Census - ^ "Об исчислении времени". Официальный интернет-портал правовой информации (in الروسية). 3 June 2011. Retrieved 19 January 2019.
- ^ الرسمية في جميع أرجاء روسيا الاتحادية حسب الفقرة 68.1 من دستور روسيا.
- ^ "National Composition of Population for Regions of the Russian Federation" (XLS). 2010 Russian All-Population Census. 2010. Retrieved 2011-12-22.
{{cite journal}}: Cite journal requires|journal=(help) - ^ Перепись-2010: русских становится больше. Perepis-2010.ru (2011-12-19). Retrieved on 2013-08-20.
- ^ "Arena: Atlas of Religions and Nationalities in Russia". Sreda, 2012.
- ^ 2012 Arena Atlas Religion Maps. "Ogonek", № 34 (5243), 27/08/2012. Retrieved 21/04/2017. Archived.
وصلات خارجية
- The official website of the public authorities Khanty-Mansi Autonomous Okrug (بالروسية) (إنگليزية)
- Official site Duma Khanty-Mansi Autonomous Okrug (بالروسية)


