إقبال الناخبين في الانتخابات الرئاسية الأمريكية
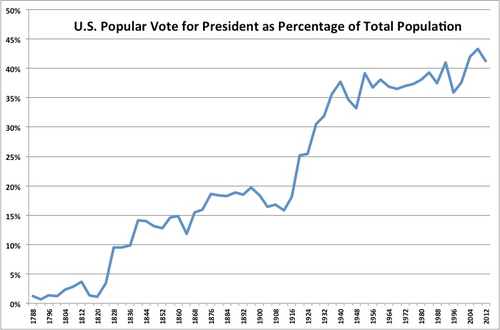
تتحدد التوجهات التاريخية في إقبال الناخبين في الانتخابات الرئاسية الأمريكية، من خلال التوسع التدريجي في حقوق التصويت من التقييد الأولي على مالكي العقارات من الذكور البيض الذين تبلغ أعمارهم 21 عاماً أو أكثر في السنوات الأولى من استقلال البلاد، لجميع المواطنين الذين يبلغون من العمر ثمانية عشر عاماً أو أكثر في منتصف القرن العشرين. كانت نسبة إقبال الناخبين في الانتخابات الرئاسية الأمريكية أعلى من نسبة المشاركة في الانتخابات النصفية.[1]
. . . . . . . . . . . . . . . . . . . . . . . . . . . . . . . . . . . . . . . . . . . . . . . . . . . . . . . . . . . . . . . . . . . . . . . . . . . . . . . . . . . . . . . . . . . . . . . . . . . . . . . . . . . . . . . . . . . . . . . . . . . . . . . . . . . . . . . . . . . . . . . . . . . . . . . . . . . . . . . . . . . . . . . .
تاريخ الإقبال الانتخابي
العمر، التعليم، والدخل
الفجوة بين الجنسين
العرقية
عوامل أخرى
إحصائيات الإقبال
| الانتخابات | عدد الناخبين المؤهلين للتصويت (VAP)[2] |
الإقبال[2] | % الإقبال من VAP[2][3] |
|---|---|---|---|
| 1789–1824 | لا توجد بيانات | ||
| 1828 | 57.6% | ||
| 1832 | 55.4% | ||
| 1836 | 57.8% | ||
| 1840 | 80.2% | ||
| 1844 | 78.9% | ||
| 1848 | 72.7% | ||
| 1852 | 69.6% | ||
| 1856 | 78.9% | ||
| 1860 | 81.2% | ||
| 1864 | 73.8% | ||
| 1868 | 78.1% | ||
| 1872 | 71.3% | ||
| 1876 | 81.8% | ||
| 1880 | 79.4% | ||
| 1884 | 77.5% | ||
| 1888 | 79.3% | ||
| 1892 | 74.7% | ||
| 1896 | 79.3% | ||
| 1900 | 73.2% | ||
| 1904 | 65.2% | ||
| 1908 | 65.4% | ||
| 1912 | 58.8% | ||
| 1916 | 61.6% | ||
| 1920 | 49.2% | ||
| 1924 | 48.9% | ||
| 1928 | 56.9% | ||
| 1932 | 75.768.000 | 39.817.000 | 52.6% |
| 1936 | 80.174.000 | 45.647.000 | 56.9% |
| 1940 | 84.728.000 | 49.815.000 | 58.8% |
| 1944 | 85.654.000 | 48.026.000 | 56.1% |
| 1948 | 95.573.000 | 48.834.000 | 51.1% |
| 1952 | 99.929.000 | 61.552.000 | 61.6% |
| 1956 | 104.515.000 | 62.027.000 | 59.3% |
| 1960 | 109.672.000 | 68.836.000 | 62.8% |
| 1964 | 114.090.000 | 70.098.000 | 61.4% |
| 1968 | 120.285.000 | 73.027.000 | 60.7% |
| 1972 | 140.777.000 | 77.625.000 | 55.1% |
| 1976 | 152.308.000 | 81.603.000 | 53.6% |
| 1980 | 163.945.000 | 86.497.000 | 52.8% |
| 1984 | 173.995.000 | 92.655.000 | 53.3% |
| 1988 | 181.956.000 | 91.587.000 | 50.3% |
| 1992 | 189.493.000 | 104.600.000 | 55.2% |
| 1996 | 196.789.000 | 96.390.000 | 49.0% |
| 2000 | 209.787.000 | 105.594.000 | 50.3% |
| 2004 | 219.553.000 | 122.349.000 | 55.7% |
| 2008 | 229.945.000 | 131.407.000 | 57.1% |
| 2012 | 235.248.000 | 129.235.000 | 54.9% |
| 2016 | 250.056.000 | 138.847.000 | 55.5% |
| 2020 | 255.200.373 | ||
انظر أيضاً
المصادر
- ^ New York Times Editorial Board (2014-11-11). "Opinion | The Worst Voter Turnout in 72 Years". The New York Times (in الإنجليزية الأمريكية). ISSN 0362-4331. Retrieved 2018-01-29.
- ^ أ ب ت بين 1932 و2008: "Table 397. Participation in Elections for President and U.S. Representatives: 1932 to 2010" (PDF). U.S. Census Bureau, Statistical Abstract of the United States: 2012. U.S. Census Bureau.
- ^ Between 1828–1928: "Voter Turnout in Presidential Elections: 1828–2008". The American Presidency Project. UC Santa Barbara. Retrieved 2012-11-09.
قراءات إضافية
- Berman, D. and Johnson, R. (2000). Age, ambition, and the local charter: a study in voting behavior. The Social Science Journal, 37(1), pp. 19–26.
- Burden, Barry C. (2009). "The dynamic effects of education on voter turnout". Electoral Studies. 28 (4): 540–549. doi:10.1016/j.electstud.2009.05.027.
- Gallego, A. (2010). Understanding unequal turnout: Education and voting in comparative perspective. Electoral Studies, 29(2), pp. 239–248.
- Gershman, C. (2018). Democracy and Democracies in Crisis. Retrieved from http://www.worldaffairsjournal.org/article/democracy-and-democracies-crisis[dead link]; also at https://isnblog.ethz.ch/politics/democracy-and-democracies-in-crisis
- Harder, J. and Krosnick, J. (2008). Why Do People Vote? A Psychological Analysis of the Causes of Voter Turnout. Journal of Social Issues, 64(3), pp. 525–549.
- Marcus, J., & Krupnick, M. (2017). The Rural Higher-Education Crisis. The Atlantic. Retrieved from https://www.theatlantic.com/education/archive/2017/09/the-rural-higher-education-crisis/541188/
- Maslow, A. (1943). A theory of human motivation. Psychological Review, 50(4), pp. 370–396.
- McDonald, Michael, United States Elections Project, http://www.electproject.org/home
- Munsey, C. (2008). Why do we vote ?. American Psychological Association.
- Pomante, Michael J.; Schraufnagel, Scot (2015). "Candidate Age and Youth Voter Turnout". American Politics Research. 43 (3): 479–503. doi:10.1177/1532673x14554829. S2CID 156019567.
- Snyder, R. (2011). The impact of age, education, political knowledge and political context on voter turnout. UNLV Theses, Dissertations, Professional Papers, And Capstones.
- Struyk, R. (2017). The Democratic Party has an age problem. CNN. [online] Available at: https://www.cnn.com/2017/10/10/politics/democrats-age-problem/index.html [Accessed 9 Jun. 2018].
- The Economist (2014). Why young people don't vote. [online] Available at: https://www.economist.com/the-economist-explains/2014/10/29/why-young-people-dont-vote [Accessed 9 Jun. 2018].
- Tolbert, Caroline J.; Smith, Daniel A. (2005). "The Educative Effects of Ballot Initiatives on Voter Turnout". American Politics Research. 33 (2): 283–309. doi:10.1177/1532673x04271904. S2CID 154470262.
