برنلي (دائرة انتخابية في المملكة المتحدة)
Coordinates: 53°47′13″N 2°14′42″W / 53.787°N 2.245°W
| Burnley | |
|---|---|
| دائرة انتخابية Borough | |
| لمجلس العموم | |
 حدود Burnley في Lancashire. | |
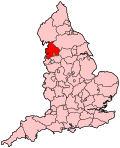 موقع Lancashire ضمن England. | |
| المقاطعة | Lancashire |
| التعداد | 87,059 (2011 census)[1] |
| المسجلون | 64,338 (December 2018)[2] |
| المستوطنات الرئيسية | Burnley |
| الدائرة الحالية | |
| خُلِقت | 1868 1868 |
| عضو البرلمان | Antony Higginbotham (Conservative) |
| عدد الأعضاء | One |
| خلقت من | North Lancashire |
| تراكب | |
| الدائرة الانتخابية الاوروبية | North West England |
برنلي إنگليزية: Burnley هي إحدى الدوائر الانتخابية في المملكة المتحدة الممثلة في مجلس العموم في برلمان المملكة المتحدة، متمركزة حول بلدة برنلي في لانكشاير.
عضو البرلمان الذي يمثلها منذ 2019 بالنائب أنتوني هگنبوتم من حزب المحافظين.[n 1]
. . . . . . . . . . . . . . . . . . . . . . . . . . . . . . . . . . . . . . . . . . . . . . . . . . . . . . . . . . . . . . . . . . . . . . . . . . . . . . . . . . . . . . . . . . . . . . . . . . . . . . . . . . . . . . . . . . . . . . . . . . . . . . . . . . . . . . . . . . . . . . . . . . . . . . . . . . . . . . . . . . . . . . . .
أعضاء البرلمان
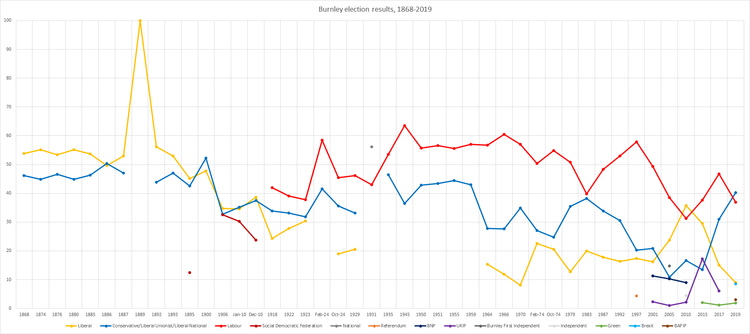
الانتخابات
الانتخابات في ع2010
| General election 2019: Burnley[5] | |||||
|---|---|---|---|---|---|
| الحزب | المرشح | الأصوات | % | ±% | |
| حزب المحافظين | Antony Higginbotham | 15,720 | 40.3 | +9.4 | |
| Labour | Julie Cooper | 14,368 | 36.9 | −9.9 | |
| Liberal Democrats | Gordon Birtwistle | 3,501 | 9.0 | −6.0 | |
| Brexit Party | Stewart Scott | 3,362 | 8.6 | N/A | |
| BAPIP | Charlie Briggs | 1,162 | 3.0 | N/A | |
| Green | Laura Fisk | 739 | 1.9 | +0.8 | |
| Independent | Karen Helsby Entwistle | 132 | 0.3 | N/A | |
| الأغلبية | 1,352 | 3.4 | N/A | ||
| الإقبال على الانتخابات | 38,984 | 60.6 | -1.6 | ||
| حزب المحافظين ربح من حزب العمال | تأرجح | +9.7 | |||
| General election 2017: Burnley[6] | |||||
|---|---|---|---|---|---|
| الحزب | المرشح | الأصوات | % | ±% | |
| Labour | Julie Cooper | 18,832 | 46.7 | +9.1 | |
| Conservative | Paul White | 12,479 | 31.0 | +17.5 | |
| Liberal Democrats | Gordon Birtwistle | 6,046 | 15.0 | −14.4 | |
| UKIP | Tom Commis | 2,472 | 6.1 | −11.1 | |
| Green | Laura Fisk | 461 | 1.1 | -1.0 | |
| الأغلبية | 6,353 | 15.7 | +7.5 | ||
| الإقبال على الانتخابات | 40,290 | 62.2 | +0.6 | ||
| حزب العمال hold | تأرجح | -4.2 | |||
| General election 2015: Burnley[7][8] | |||||
|---|---|---|---|---|---|
| الحزب | المرشح | الأصوات | % | ±% | |
| Labour | Julie Cooper | 14,951 | 37.6 | +6.3 | |
| Liberal Democrats | Gordon Birtwistle | 11,707 | 29.5 | −6.2 | |
| UKIP | Tom Commis | 6,864 | 17.3 | +15.0 | |
| Conservative | Sarah Cockburn-Price | 5,374 | 13.5 | −3.1 | |
| Green | Mike Hargreaves | 850 | 2.1 | N/A | |
| الأغلبية | 3,244 | 8.2 | |||
| الإقبال على الانتخابات | 39,746 | 61.6 | |||
| حزب العمال ربح من حزب الديمقراطيين الليبراليين | تأرجح | +6.3 | |||
| General election 2010: Burnley[9][10] | |||||
|---|---|---|---|---|---|
| الحزب | المرشح | الأصوات | % | ±% | |
| Liberal Democrats | Gordon Birtwistle | 14,932 | 35.7 | +12.0 | |
| Labour | Julie Cooper | 13,114 | 31.3 | −7.2 | |
| Conservative | Richard Ali | 6,950 | 16.6 | +5.8 | |
| BNP | Sharon Wilkinson | 3,747 | 9.0 | −1.3 | |
| Independent | Andrew Brown | 1,876 | 4.5 | N/A | |
| UKIP | John Wignall | 929 | 2.2 | +1.2 | |
| Independent | Andrew Hennessey | 287 | 0.7 | N/A | |
| الأغلبية | 1,818 | 4.3 | |||
| الإقبال على الانتخابات | 41,845 | 62.8 | |||
| حزب الديمقراطيين الليبراليين ربح من حزب العمال | تأرجح | +9.6 | |||
. . . . . . . . . . . . . . . . . . . . . . . . . . . . . . . . . . . . . . . . . . . . . . . . . . . . . . . . . . . . . . . . . . . . . . . . . . . . . . . . . . . . . . . . . . . . . . . . . . . . . . . . . . . . . . . . . . . . . . . . . . . . . . . . . . . . . . . . . . . . . . . . . . . . . . . . . . . . . . . . . . . . . . . .
Elections in the 2000s
|
2010s – 2000s – 1990s – 1980s – 1970s – 1960s – 1950s – 1940s – 1930s – 1920s – 1910s – 1900s – 1890s – 1880s – 1870s – 1860s – Back to Top |
| General election 2005: Burnley[11] | |||||
|---|---|---|---|---|---|
| الحزب | المرشح | الأصوات | % | ±% | |
| Labour | Kitty Ussher | 14,999 | 38.5 | −10.8 | |
| Liberal Democrats | Gordon Birtwistle | 9,221 | 23.7 | +7.5 | |
| Burnley First Independent | Harry Brooks | 5,786 | 14.8 | N/A | |
| Conservative | Yousuf Miah | 4,206 | 10.8 | −10.1 | |
| BNP | Len Starr | 4,003 | 10.3 | −1.0 | |
| Independent | Jeff Slater | 392 | 1.0 | N/A | |
| UKIP | Robert McDowell | 376 | 1.0 | −1.3 | |
| الأغلبية | 5,778 | 14.8 | |||
| الإقبال على الانتخابات | 38,983 | 59.2 | +3.5 | ||
| حزب العمال hold | تأرجح | −9.15[n 2] | |||
| General election 2001: Burnley[12] | |||||
|---|---|---|---|---|---|
| الحزب | المرشح | الأصوات | % | ±% | |
| Labour | Peter Pike | 18,195 | 49.3 | −8.6 | |
| Conservative | Robert Frost | 7,697 | 20.9 | +0.6 | |
| Liberal Democrats | Paul Wright | 5,975 | 16.2 | −1.2 | |
| BNP | Steve Smith | 4,151 | 11.3 | N/A | |
| UKIP | Richard Buttrey | 866 | 2.3 | N/A | |
| الأغلبية | 10,498 | 28.4 | |||
| الإقبال على الانتخابات | 36,884 | 55.7 | −11.3 | ||
| حزب العمال hold | تأرجح | −4.6 | |||
Elections in the 1990s
|
2010s – 2000s – 1990s – 1980s – 1970s – 1960s – 1950s – 1940s – 1930s – 1920s – 1910s – 1900s – 1890s – 1880s – 1870s – 1860s – Back to Top |
| General election 1997: Burnley[13] | |||||
|---|---|---|---|---|---|
| الحزب | المرشح | الأصوات | % | ±% | |
| Labour | Peter Pike | 26,210 | 57.9 | +4.9 | |
| Conservative | Bill Wiggin | 9,148 | 20.2 | −10.4 | |
| Liberal Democrats | Gordon Birtwistle | 7,877 | 17.4 | +1.0 | |
| Referendum | Richard Oakley | 2,010 | 4.4 | N/A | |
| الأغلبية | 17,062 | 37.7 | +15.3 | ||
| الإقبال على الانتخابات | 45,245 | 66.9 | −7.5 | ||
| حزب العمال hold | تأرجح | +7.65 | |||
| General election 1992: Burnley[14][15] | |||||
|---|---|---|---|---|---|
| الحزب | المرشح | الأصوات | % | ±% | |
| Labour | Peter Pike | 27,184 | 53.0 | +4.6 | |
| Conservative | Brenda Binge | 15,693 | 30.6 | −3.2 | |
| Liberal Democrats | Gordon Birtwistle | 8,414 | 16.4 | −1.4 | |
| الأغلبية | 11,491 | 22.4 | +7.9 | ||
| الإقبال على الانتخابات | 51,291 | 74.2 | −4.6 | ||
| حزب العمال hold | تأرجح | +3.9 | |||
. . . . . . . . . . . . . . . . . . . . . . . . . . . . . . . . . . . . . . . . . . . . . . . . . . . . . . . . . . . . . . . . . . . . . . . . . . . . . . . . . . . . . . . . . . . . . . . . . . . . . . . . . . . . . . . . . . . . . . . . . . . . . . . . . . . . . . . . . . . . . . . . . . . . . . . . . . . . . . . . . . . . . . . .
Elections in the 1980s
|
2010s – 2000s – 1990s – 1980s – 1970s – 1960s – 1950s – 1940s – 1930s – 1920s – 1910s – 1900s – 1890s – 1880s – 1870s – 1860s – Back to Top |
| General election 1987: Burnley[16] | |||||
|---|---|---|---|---|---|
| الحزب | المرشح | الأصوات | % | ±% | |
| Labour | Peter Pike | 25,140 | 48.4 | +8.6 | |
| Conservative | Harold Elletson | 17,583 | 33.8 | −4.4 | |
| SDP | Ronals Baker | 9,241 | 17.8 | −2.2 | |
| الأغلبية | 7,557 | 14.5 | |||
| الإقبال على الانتخابات | 51,964 | 78.8 | |||
| حزب العمال hold | تأرجح | +6.5 | |||
| General election 1983: Burnley[17] | |||||
|---|---|---|---|---|---|
| الحزب | المرشح | الأصوات | % | ±% | |
| Labour | Peter Pike | 20,178 | 39.8 | −11.0 | |
| Conservative | Ian Bruce | 19,391 | 38.2 | +2.8 | |
| Liberal | Michael Steed | 11,191 | 20.0 | +7.2 | |
| الأغلبية | 787 | 1.6 | |||
| الإقبال على الانتخابات | 50,760 | 76.3 | |||
| حزب العمال hold | تأرجح | −6.9 | |||
الانتخابات في ع1970
|
2010s – 2000s – 1990s – 1980s – 1970s – 1960s – 1950s – 1940s – 1930s – 1920s – 1910s – 1900s – 1890s – 1880s – 1870s – 1860s – Back to Top |
| General election 1979: Burnley | |||||
|---|---|---|---|---|---|
| الحزب | المرشح | الأصوات | % | ±% | |
| Labour | Dan Jones | 20,172 | 50.8 | −4.0 | |
| Conservative | Ann Widdecombe | 14,062 | 35.4 | +8.7 | |
| Liberal | Michael Steed | 5,091 | 12.8 | -7.7 | |
| Independent Democrat | F Tyrrall | 352 | 0.9 | N/A | |
| الأغلبية | 6,110 | 15.4 | -14.7 | ||
| الإقبال على الانتخابات | |||||
| حزب العمال hold | تأرجح | ||||
| General election October 1974: Burnley | |||||
|---|---|---|---|---|---|
| الحزب | المرشح | الأصوات | % | ±% | |
| Labour | Dan Jones | 21,642 | 54.8 | ||
| Conservative | A Pickup | 9,766 | 24.7 | ||
| Liberal | SP Mews | 8,119 | 20.5 | ||
| الأغلبية | 11,876 | 30.1 | |||
| الإقبال على الانتخابات | 79.7 | ||||
| حزب العمال hold | تأرجح | 3.3% | |||
| General election February 1974: Burnley | |||||
|---|---|---|---|---|---|
| الحزب | المرشح | الأصوات | % | ±% | |
| Labour | Dan Jones | 21,108 | 50.4 | ||
| Conservative | A. Pickup | 11,268 | 27.0 | ||
| Liberal | S. Mews | 9,471 | 22.6 | ||
| الأغلبية | 9,840 | 23.5 | |||
| الإقبال على الانتخابات | 79.7 | ||||
| حزب العمال hold | تأرجح | ||||
| General election 1970: Burnley[18] | |||||
|---|---|---|---|---|---|
| الحزب | المرشح | الأصوات | % | ±% | |
| Labour | Dan Jones | 24,200 | 57.0 | ||
| Conservative | John Birch | 14,846 | 34.9 | ||
| Liberal | George Brownbill | 3,446 | 8.11 | ||
| الأغلبية | 9,354 | 22.0 | |||
| الإقبال على الانتخابات | 75.7 | ||||
| حزب العمال hold | تأرجح | ||||
Elections in the 1960s
|
2010s – 2000s – 1990s – 1980s – 1970s – 1960s – 1950s – 1940s – 1930s – 1920s – 1910s – 1900s – 1890s – 1880s – 1870s – 1860s – Back to Top |
| General election 1966: Burnley[19] | |||||
|---|---|---|---|---|---|
| الحزب | المرشح | الأصوات | % | ±% | |
| Labour | Dan Jones | 25,583 | 60.43 | ||
| Conservative | Albert S Royse | 11,710 | 27.66 | ||
| Liberal | Mary R Mason | 5,045 | 11.92 | ||
| الأغلبية | 13,873 | 32.77 | |||
| الإقبال على الانتخابات | 79.96 | ||||
| حزب العمال hold | تأرجح | ||||
| General election 1964: Burnley[20] | |||||
|---|---|---|---|---|---|
| الحزب | المرشح | الأصوات | % | ±% | |
| Labour | Dan Jones | 25,244 | 56.80 | ||
| Conservative | Tom Mitchell | 12,365 | 27.82 | ||
| Liberal | Mary R Mason | 6,833 | 15.38 | ||
| الأغلبية | 12,879 | 28.98 | |||
| الإقبال على الانتخابات | 81.68 | ||||
| حزب العمال hold | تأرجح | ||||
Elections in the 1950s
|
2010s – 2000s – 1990s – 1980s – 1970s – 1960s – 1950s – 1940s – 1930s – 1920s – 1910s – 1900s – 1890s – 1880s – 1870s – 1860s – Back to Top |
| General election 1959: Burnley[21] | |||||
|---|---|---|---|---|---|
| الحزب | المرشح | الأصوات | % | ±% | |
| Labour | Dan Jones | 27,675 | 56.97 | ||
| Conservative | Edward Brooks | 20,902 | 43.03 | ||
| الأغلبية | 6,773 | 13.94 | |||
| الإقبال على الانتخابات | 83.77 | ||||
| حزب العمال hold | تأرجح | ||||
| General election 1955: Burnley[22] | |||||
|---|---|---|---|---|---|
| الحزب | المرشح | الأصوات | % | ±% | |
| Labour | Wilfrid Burke | 27,865 | 55.63 | ||
| Conservative | Edward Brooks | 22,229 | 44.37 | ||
| الأغلبية | 5,636 | 11.25 | |||
| الإقبال على الانتخابات | 83.46 | ||||
| حزب العمال hold | تأرجح | ||||
| General election 1951: Burnley[23] | |||||
|---|---|---|---|---|---|
| الحزب | المرشح | الأصوات | % | ±% | |
| Labour | Wilfrid Burke | 31,261 | 56.53 | ||
| Conservative | Donald P Dunkley | 24,034 | 43.37 | ||
| الأغلبية | 7,227 | 13.07 | |||
| الإقبال على الانتخابات | 88.86 | ||||
| حزب العمال hold | تأرجح | ||||
| General election 1950: Burnley | |||||
|---|---|---|---|---|---|
| الحزب | المرشح | الأصوات | % | ±% | |
| Labour | Wilfrid Burke | 30,685 | 55.65 | ||
| Conservative | F.H. Wilson | 23,636 | 42.86 | ||
| Communist | Bill Whittaker[24] | 526 | 0.95 | ||
| Ind. Labour Party | Dan Carradice | 295 | 0.53 | ||
| الأغلبية | 7,049 | 12.78 | |||
| الإقبال على الانتخابات | 89.56 | ||||
| حزب العمال hold | تأرجح | ||||
Election in the 1940s
|
2010s – 2000s – 1990s – 1980s – 1970s – 1960s – 1950s – 1940s – 1930s – 1920s – 1910s – 1900s – 1890s – 1880s – 1870s – 1860s – Back to Top |
| General election 1945: Burnley | |||||
|---|---|---|---|---|---|
| الحزب | المرشح | الأصوات | % | ±% | |
| Labour | Wilfrid Burke | 32,122 | 63.54 | ||
| Liberal National | Herbert Monckton Milnes | 18,431 | 36.46 | ||
| الأغلبية | 13,691 | 27.08 | |||
| الإقبال على الانتخابات | 80.44 | ||||
| حزب العمال hold | تأرجح | ||||
الانتخابات في ع1930
|
2010s – 2000s – 1990s – 1980s – 1970s – 1960s – 1950s – 1940s – 1930s – 1920s – 1910s – 1900s – 1890s – 1880s – 1870s – 1860s – Back to Top |
| General election 1935: Burnley | |||||
|---|---|---|---|---|---|
| الحزب | المرشح | الأصوات | % | ±% | |
| Labour | Wilfrid Burke | 31,160 | 53.61 | ||
| Liberal National | Gordon Campbell | 26,965 | 46.39 | ||
| الأغلبية | 4,195 | 7.22 | |||
| الإقبال على الانتخابات | 87.36 | ||||
| حزب العمال ربح من الوطنيون الليبراليون | تأرجح | ||||
| General election 1931: Burnley[25] | |||||
|---|---|---|---|---|---|
| الحزب | المرشح | الأصوات | % | ±% | |
| National | Gordon Campbell | 35,126 | 56.15 | ||
| Labour | Arthur Henderson | 26,917 | 43.03 | ||
| Communist | J. Rushton | 512 | 0.82 | ||
| الأغلبية | 8,209 | 13.12 | |||
| الإقبال على الانتخابات | 91.85 | ||||
| الوطنية ربح من حزب العمال | تأرجح | ||||
Elections in the 1920s
|
2010s – 2000s – 1990s – 1980s – 1970s – 1960s – 1950s – 1940s – 1930s – 1920s – 1910s – 1900s – 1890s – 1880s – 1870s – 1860s – Back to Top |
| General election 1929: Burnley[26] | |||||
|---|---|---|---|---|---|
| الحزب | المرشح | الأصوات | % | ±% | |
| Labour | Arthur Henderson | 28,091 | 46.2 | +0.8 | |
| Unionist | Ian Fairbairn | 20,137 | 33.2 | −2.4 | |
| Liberal | Aneurin Edwards | 12,502 | 20.6 | +1.6 | |
| الأغلبية | 7,954 | 13.0 | +3.2 | ||
| الإقبال على الانتخابات | 60,730 | 89.6 | +1.2 | ||
| ناخبون مسجلون | 67,781 | ||||
| حزب العمال hold | تأرجح | +1.6 | |||
| General election 1924: Burnley[26] | |||||
|---|---|---|---|---|---|
| الحزب | المرشح | الأصوات | % | ±% | |
| Labour | Arthur Henderson | 20,549 | 45.4 | +7.6 | |
| Unionist | Ian Fairbairn | 16,804 | 35.6 | +3.8 | |
| Liberal | James Whitehead | 8,601 | 19.0 | −11.4 | |
| الأغلبية | 4,465 | 9.8 | +3.8 | ||
| الإقبال على الانتخابات | 45,954 | 88.4 | +1.1 | ||
| ناخبون مسجلون | 51,162 | ||||
| حزب العمال hold | تأرجح | +1.9 | |||
| 1924 Burnley by-election[27] | |||||
|---|---|---|---|---|---|
| الحزب | المرشح | الأصوات | % | ±% | |
| Labour | Arthur Henderson | 24,571 | 58.4 | +20.6 | |
| Conservative | Harold Edward Joscelyn Camps | 17,534 | 41.6 | +9.8 | |
| الأغلبية | 7,037 | 16.8 | +10.8 | ||
| الإقبال على الانتخابات | 42,105 | 82.4 | −4.9 | ||
| ناخبون مسجلون | 51,086 | ||||
| حزب العمال hold | تأرجح | +5.4 | |||
| General election 1923: Burnley[26] | |||||
|---|---|---|---|---|---|
| الحزب | المرشح | الأصوات | % | ±% | |
| Labour | Dan Irving | 16,848 | 37.8 | −1.3 | |
| Unionist | Harold Edward Joscelyn Camps | 14,197 | 31.8 | −1.3 | |
| Liberal | James Whitehead | 13,543 | 30.4 | +2.6 | |
| الأغلبية | 2,651 | 6.0 | - | ||
| الإقبال على الانتخابات | 44,588 | 87.3 | −1.4 | ||
| ناخبون مسجلون | 51,086 | ||||
| حزب العمال hold | تأرجح | 0.0 | |||
| General election 1922: Burnley[26] | |||||
|---|---|---|---|---|---|
| الحزب | المرشح | الأصوات | % | ±% | |
| Labour | Dan Irving | 17,385 | 39.1 | −2.8 | |
| Unionist | Harold Edward Joscelyn Camps | 14,731 | 33.1 | −0.7 | |
| Liberal | Walter Layton | 12,339 | 27.8 | +3.5 | |
| الأغلبية | 2,654 | 6.0 | −2.1 | ||
| الإقبال على الانتخابات | 44,455 | 88.7 | +17.3 | ||
| ناخبون مسجلون | 50,111 | ||||
| حزب العمال hold | تأرجح | −1.1 | |||
Elections in the 1910s
|
2010s – 2000s – 1990s – 1980s – 1970s – 1960s – 1950s – 1940s – 1930s – 1920s – 1910s – 1900s – 1890s – 1880s – 1870s – 1860s – Back to Top |
- British Socialist Party: Dan Irving[28]
| General election December 1918: Burnley | |||||
|---|---|---|---|---|---|
| الحزب | المرشح | الأصوات | % | ±% | |
| Labour | Dan Irving | 15,217 | 41.9 | +18.1 | |
| Liberal | John Howarth Grey | 8,825 | 24.3 | -14.3 | |
| الأغلبية | 2,928 | 8.1 | |||
| الإقبال على الانتخابات | 21,114 | 71.4 | −22.7 | ||
| حزب العمال ربح من الليبرالي | تأرجح | +16.2 | |||
| General election December 1910: Burnley[29] | |||||
|---|---|---|---|---|---|
| الحزب | المرشح | الأصوات | % | ±% | |
| Liberal | Philip Morrell | 6,177 | 38.7 | +4.1 | |
| Conservative | Gerald Arbuthnot | 6,004 | 37.5 | +2.3 | |
| Social Democratic Federation | Henry Hyndman | 3,810 | 23.8 | -6.4 | |
| الأغلبية | 173 | 1.2 | N/A | ||
| الإقبال على الانتخابات | 15,991 | 94.1 | −2.4 | ||
| ناخبون مسجلون | 16,992 | ||||
| الليبرالي ربح من حزب المحافظين | تأرجح | +0.9 | |||
| General election January 1910: Burnley[30][29] | |||||
|---|---|---|---|---|---|
| الحزب | المرشح | الأصوات | % | ±% | |
| Conservative | Gerald Arbuthnot | 5,776 | 35.2 | +2.5 | |
| Lib-Lab | Fred Maddison | 5,681 | 34.6 | −0.2 | |
| Social Democratic Federation | Henry Hyndman | 4,948 | 30.2 | −2.3 | |
| الأغلبية | 95 | 0.6 | N/A | ||
| الإقبال على الانتخابات | 16,405 | 96.5 | +1.5 | ||
| ناخبون مسجلون | 16,992 | ||||
| حزب المحافظين ربح من لِب-لاب | تأرجح | +1.4 | |||
الانتخابات في ع1900
|
2010s – 2000s – 1990s – 1980s – 1970s – 1960s – 1950s – 1940s – 1930s – 1920s – 1910s – 1900s – 1890s – 1880s – 1870s – 1860s – Back to Top |
| General election 1906: Burnley[30][29] | |||||
|---|---|---|---|---|---|
| الحزب | المرشح | الأصوات | % | ±% | |
| Lib-Lab | Fred Maddison | 5,288 | 34.8 | −12.9 | |
| Conservative | Gerald Arbuthnot | 4,964 | 32.7 | −19.6 | |
| Social Democratic Federation | Henry Hyndman | 4,932 | 32.5 | N/A | |
| الأغلبية | 324 | 2.1 | N/A | ||
| الإقبال على الانتخابات | 15,184 | 95.0 | +5.1 | ||
| ناخبون مسجلون | 15,983 | ||||
| لِب-لاب ربح من حزب المحافظين | تأرجح | +3.4 | |||
| General election 1900: Burnley[30][29] | |||||
|---|---|---|---|---|---|
| الحزب | المرشح | الأصوات | % | ±% | |
| Conservative | William Mitchell | 6,678 | 52.3 | +9.8 | |
| Liberal | Philip Stanhope | 6,173 | 47.7 | +2.6 | |
| الأغلبية | 600 | 4.6 | N/A | ||
| الإقبال على الانتخابات | 12,946 | 89.9 | −0.6 | ||
| ناخبون مسجلون | 14,393 | ||||
| حزب المحافظين ربح من الليبرالي | تأرجح | +3.6 | |||
Elections in the 1890s
|
2010s – 2000s – 1990s – 1980s – 1970s – 1960s – 1950s – 1940s – 1930s – 1920s – 1910s – 1900s – 1890s – 1880s – 1870s – 1860s – Back to Top |
| General election 1895: Burnley[30][29] | |||||
|---|---|---|---|---|---|
| الحزب | المرشح | الأصوات | % | ±% | |
| Liberal | Philip Stanhope | 5,454 | 45.1 | −11.1 | |
| Conservative | William Alexander Lindsay[31] | 5,133 | 42.5 | −1.3 | |
| Social Democratic Federation | Henry Hyndman | 1,498 | 12.4 | N/A | |
| الأغلبية | 321 | 2.6 | −9.8 | ||
| الإقبال على الانتخابات | 12,085 | 90.5 | −0.5 | ||
| ناخبون مسجلون | 13,360 | ||||
| الليبرالي hold | تأرجح | −4.9 | |||
| 1893 Burnley by-election[30][29] | |||||
|---|---|---|---|---|---|
| الحزب | المرشح | الأصوات | % | ±% | |
| Liberal | Philip Stanhope | 6,199 | 53.0 | −3.2 | |
| Conservative | William Alexander Lindsay[31] | 5,506 | 47.0 | +3.2 | |
| الأغلبية | 693 | 6.0 | −6.4 | ||
| الإقبال على الانتخابات | 11,705 | 91.3 | +0.3 | ||
| ناخبون مسجلون | 12,826 | ||||
| الليبرالي hold | تأرجح | −3.2 | |||
| General election 1892: Burnley[30][29] | |||||
|---|---|---|---|---|---|
| الحزب | المرشح | الأصوات | % | ±% | |
| Liberal | Jabez Balfour | 6,450 | 56.2 | +6.5 | |
| Liberal Unionist | Edwin Lawrence | 5,035 | 43.8 | −6.5 | |
| الأغلبية | 1,415 | 12.4 | N/A | ||
| الإقبال على الانتخابات | 11,485 | 91.0 | +4.1 | ||
| ناخبون مسجلون | 12,619 | ||||
| الليبرالي ربح من الاتحادي الليبرالي | تأرجح | +6.5 | |||
Elections in the 1880s
|
2010s – 2000s – 1990s – 1980s – 1970s – 1960s – 1950s – 1940s – 1930s – 1920s – 1910s – 1900s – 1890s – 1880s – 1870s – 1860s – Back to Top |
| By-election, 27 Feb 1889: Burnley[29][30] | |||||
|---|---|---|---|---|---|
| الحزب | المرشح | الأصوات | % | ±% | |
| الليبرالي | Jabez Balfour | Unopposed | |||
| الليبرالي فوز من الاتحادي الليبرالي | |||||
- Caused by Stagg's death.
| By-election, 19 Feb 1887: Burnley[30][29] | |||||
|---|---|---|---|---|---|
| الحزب | المرشح | الأصوات | % | ±% | |
| Liberal | John Slagg | 5,026 | 52.9 | +3.2 | |
| Conservative | John Thursby[32] | 4,481 | 47.1 | −3.2 | |
| الأغلبية | 545 | 5.8 | N/A | ||
| الإقبال على الانتخابات | 9,507 | 94.9 | +8.0 | ||
| ناخبون مسجلون | 10,020 | ||||
| الليبرالي ربح من الاتحادي الليبرالي | تأرجح | +3.2 | |||
- Caused by Ryland's death.
| General election 1886: Burnley[30][29] | |||||
|---|---|---|---|---|---|
| الحزب | المرشح | الأصوات | % | ±% | |
| Liberal Unionist | Peter Rylands | 4,209 | 50.3 | +4.0 | |
| Liberal | James Greenwood[33] | 4,166 | 49.7 | −4.0 | |
| الأغلبية | 43 | 0.6 | N/A | ||
| الإقبال على الانتخابات | 8,375 | 86.9 | −7.2 | ||
| ناخبون مسجلون | 9,638 | ||||
| الاتحادي الليبرالي ربح من الليبرالي | تأرجح | +4.0 | |||
| General election 1885: Burnley[30][34][29] | |||||
|---|---|---|---|---|---|
| الحزب | المرشح | الأصوات | % | ±% | |
| Liberal | Peter Rylands | 4,866 | 53.7 | −1.4 | |
| Conservative | Henry Herbert Wainwright | 4,199 | 46.3 | +1.4 | |
| الأغلبية | 667 | 7.4 | −2.7 | ||
| الإقبال على الانتخابات | 9,065 | 94.1 | +0.1 | ||
| ناخبون مسجلون | 9,638 | ||||
| الليبرالي hold | تأرجح | −1.4 | |||
| General election 1880: Burnley[35] | |||||
|---|---|---|---|---|---|
| الحزب | المرشح | الأصوات | % | ±% | |
| Liberal | Peter Rylands | 3,943 | 55.1 | −0.1 | |
| Conservative | Edmund Talbot | 3,217 | 44.9 | +0.1 | |
| الأغلبية | 726 | 10.1 | −0.3 | ||
| الإقبال على الانتخابات | 7,160 | 94.0 | +9.9 | ||
| ناخبون مسجلون | 7,614 | ||||
| الليبرالي hold | تأرجح | −0.1 | |||
الانتخابات في ع1870
|
2010s – 2000s – 1990s – 1980s – 1970s – 1960s – 1950s – 1940s – 1930s – 1920s – 1910s – 1900s – 1890s – 1880s – 1870s – 1860s – Back to Top |
| By-election, 14 Feb 1876: Burnley[36][35] | |||||
|---|---|---|---|---|---|
| الحزب | المرشح | الأصوات | % | ±% | |
| Liberal | Peter Rylands | 3,520 | 53.4 | −1.8 | |
| Conservative | William Alexander Lindsay[37] | 3,077 | 46.6 | +1.8 | |
| الأغلبية | 433 | 6.6 | −3.8 | ||
| الإقبال على الانتخابات | 6,597 | 92.6 | +8.5 | ||
| ناخبون مسجلون | 7,127 | ||||
| الليبرالي hold | تأرجح | −1.8 | |||
- Caused by Shaw's death.
| General election 1874: Burnley[35] | |||||
|---|---|---|---|---|---|
| الحزب | المرشح | الأصوات | % | ±% | |
| Liberal | Richard Shaw | 3,065 | 55.2 | +1.3 | |
| Conservative | William Alexander Lindsay[37] | 2,490 | 44.8 | −1.3 | |
| الأغلبية | 575 | 10.4 | +2.5 | ||
| الإقبال على الانتخابات | 5,555 | 84.1 | +8.4 | ||
| ناخبون مسجلون | 6,607 | ||||
| الليبرالي hold | تأرجح | +1.3 | |||
الانتخابات في ع1860
|
2010s – 2000s – 1990s – 1980s – 1970s – 1960s – 1950s – 1940s – 1930s – 1920s – 1910s – 1900s – 1890s – 1880s – 1870s – 1860s – Back to Top |
| General election 1868: Burnley[35] | |||||
|---|---|---|---|---|---|
| الحزب | المرشح | الأصوات | % | ±% | |
| Liberal | Richard Shaw | 2,620 | 53.9 | N/A | |
| Conservative | James Yorke Scarlett | 2,238 | 46.1 | N/A | |
| الأغلبية | 382 | 7.9 | N/A | ||
| الإقبال على الانتخابات | 4,858 | 75.7 | N/A | ||
| ناخبون مسجلون | 6,417 | ||||
| الليبرالي فوز (مقعد جديد) | |||||
انظر أيضاً
ملاحظات وهوامش
- ملاحظات
- ^ As with all constituencies, the constituency elects one Member of Parliament (MP) by the first past the post system of election at least every five years.
- ^ Labour to Liberal Democrat
- المراجع
- ^ "Burnley: Usual Resident Population, 2011". Neighbourhood Statistics. Office for National Statistics. Retrieved 7 February 2015.
- ^ England Parliamentary electorates Boundary Commission for England
- ^ "Burnley 1868-". Hansard 1803-2005. UK Parliament. Retrieved 2 February 2015.
- ^ Leigh Rayment's Historical List of MPs – Constituencies beginning with "B" (part 6)
- ^ https://www.burnley.gov.uk/sites/default/files/Statement%20of%20Persons%20Nominated,%20Notice%20of%20Poll%20and%20Situation%20of%20Polling%20Stations.PDF
- ^ "ELECTION 2017: The five Lib Dem target seats in the North West". ITV News.
- ^ "Election Data 2015". Electoral Calculus. Archived from the original on 17 October 2015. Retrieved 17 October 2015.
- ^ "Burnley". BBC News. Retrieved 11 May 2015.
- ^ "Election Data 2010". Electoral Calculus. Archived from the original on 26 July 2013. Retrieved 17 October 2015.
- ^ "Election 2010 | Constituency | Burnley". BBC News. Retrieved 8 June 2010.
- ^ "Election Data 2005". Electoral Calculus. Archived from the original on 15 October 2011. Retrieved 18 October 2015.
- ^ "Election Data 2001". Electoral Calculus. Archived from the original on 15 October 2011. Retrieved 18 October 2015.
- ^ "Election Data 1997". Electoral Calculus. Archived from the original on 15 October 2011. Retrieved 18 October 2015.
- ^ "Election Data 1992". Electoral Calculus. Archived from the original on 15 October 2011. Retrieved 18 October 2015.
- ^ "UK General Election results April 1992". Richard Kimber's Political Science Resources. Politics Resources. 9 April 1992. Archived from the original on 11 August 2011. Retrieved 6 December 2010.
- ^ "Election Data 1987". Electoral Calculus. Archived from the original on 15 October 2011. Retrieved 18 October 2015.
- ^ "Election Data 1983". Electoral Calculus. Archived from the original on 15 October 2011. Retrieved 18 October 2015.
- ^ The Times' Guide to the House of Commons. 1970.
- ^ The Times' Guide to the House of Commons. 1966.
- ^ The Times' Guide to the House of Commons. 1964.
- ^ The Times' Guide to the House of Commons. 1959.
- ^ The Times' Guide to the House of Commons. 1955.
- ^ The Times' Guide to the House of Commons. 1951.
- ^ Stevenson, Graham. "Whittaker Bill". Archived from the original on 17 April 2017. Retrieved 17 April 2017.
- ^ Craig, F.W.S., ed. (1969). British parliamentary election results 1918-1949. Glasgow: Political Reference Publications. p. 110. ISBN 0-900178-01-9.
- ^ أ ب ت ث British Parliamentary Election Results 1918-1949, FWS Craig
- ^ "BURNLEY BY-ELECTION". The Register (Adelaide). Vol. LXXXIX, no. 25, 952. South Australia. 1 March 1924. p. 10. Retrieved 18 May 2017 – via National Library of Australia.
- ^ "British Socialist Party". Manchester Guardian. 13 April 1914.
- ^ أ ب ت ث ج ح خ د ذ ر ز Craig, FWS, ed. (1974). British Parliamentary Election Results: 1885-1918. London: Macmillan Press. ISBN 9781349022984.
- ^ أ ب ت ث ج ح خ د ذ ر The Constitutional Year Book, National Unionist Association of Conservative and Liberal Unionist Organizations (1916)
- ^ أ ب "The Election at Burnley". Preston Herald. 8 February 1893. p. 2. Retrieved 23 November 2017.
- ^ "The Burnley Election". Manchester Courier and Lancashire General Advertiser. 21 February 1887. p. 8. Retrieved 24 November 2017.
- ^ "Burnley". Preston Herald. 9 February 1887. p. 5. Retrieved 24 November 2017.
- ^ Debrett's House of Commons & Judicial Bench, 1886
- ^ أ ب ت ث Craig, F. W. S., ed. (1977). British Parliamentary Election Results 1832-1885 (e-book) (1st ed.). London: Macmillan Press. ISBN 978-1-349-02349-3.
- ^ "Burnley Election". Sheffield Daily Telegraph. 14 February 1876. Retrieved 5 October 2016 – via British Newspaper Archive.
- ^ أ ب "The nomination of candidates to fill the vacancy in Burnley". Bradford Observer. 10 February 1876. p. 8. Retrieved 28 December 2017 – via British Newspaper Archive.
وصلات خارجية
- nomis Constituency Profile for Burnley – presenting data from the ONS annual population survey and other official statistics.
- Wikipedia articles incorporating an LRPP-MP template with two unnamed parameters
- CS1: Julian–Gregorian uncertainty
- Coordinates on Wikidata
- Articles containing إنگليزية-language text
- Articles with hatnote templates targeting a nonexistent page
- Parliamentary constituencies in North West England
- United Kingdom Parliamentary constituencies established in 1868
- سياسة برنلي
- دوائر انتخابية في المملكة المتحدة
