مطيافية دورانية-اهتزازية
| الترابط في العلوم |
|---|
| الترابط الكلاسيكي |
| ترابط كمومي |
المطيافية الدورانية-الاهتزازية Rotational–vibrational spectroscopy هو فرع من المطيافية الجزيئية يتعلق بـ infrared and Raman spectra of molecules in the gas phase. Transitions involving changes in both vibrational and rotational states can be abbreviated as rovibrational (or ro-vibrational) transitions. When such transitions emit or absorb photons (electromagnetic radiation), the frequency is proportional to the difference in energy levels and can be detected by certain kinds of spectroscopy. Since changes in rotational energy levels are typically much smaller than changes in vibrational energy levels, changes in rotational state are said to give fine structure to the vibrational spectrum. For a given vibrational transition, the same theoretical treatment as for pure rotational spectroscopy gives the rotational quantum numbers, energy levels, and selection rules. In linear and spherical top molecules, rotational lines are found as simple progressions at both higher and lower frequencies relative to the pure vibration frequency. In symmetric top molecules the transitions are classified as parallel when the dipole moment change is parallel to the principal axis of rotation, and perpendicular when the change is perpendicular to that axis. The ro-vibrational spectrum of the asymmetric rotor water is important because of the presence of water vapor in the atmosphere.
. . . . . . . . . . . . . . . . . . . . . . . . . . . . . . . . . . . . . . . . . . . . . . . . . . . . . . . . . . . . . . . . . . . . . . . . . . . . . . . . . . . . . . . . . . . . . . . . . . . . . . . . . . . . . . . . . . . . . . . . . . . . . . . . . . . . . . . . . . . . . . . . . . . . . . . . . . . . . . . . . . . . . . . .
استعراض
Ro-vibrational spectroscopy concerns molecules in the gas phase. There are sequences of quantized rotational levels associated with both the ground and excited vibrational states. The spectra are often resolved into lines due to transitions from one rotational level in the ground vibrational state to one rotational level in the vibrationally excited state. The lines corresponding to a given vibrational transition form a band.[1]
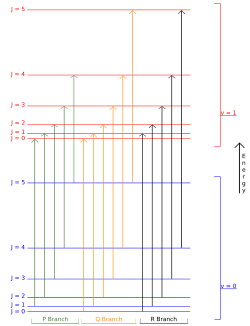
In the simplest cases the part of the infrared spectrum involving vibrational transitions with the same rotational quantum number (ΔJ = 0) in ground and excited states is called the Q-branch. On the high frequency side of the Q-branch the energy of rotational transitions is added to the energy of the vibrational transition. This is known as the R-branch of the spectrum for ΔJ = +1. The P-branch for ΔJ = −1 lies on the low wavenumber side of the Q branch. The appearance of the R-branch is very similar to the appearance of the pure rotation spectrum (but shifted to much higher wavenumbers), and the P-branch appears as a nearly mirror image of the R-branch.[note 1] The Q branch is sometimes missing because of transitions with no change in J being forbidden.
The appearance of rotational fine structure is determined by the symmetry of the molecular rotors which are classified, in the same way as for pure rotational spectroscopy, into linear molecules, spherical-, symmetric- and asymmetric- rotor classes. The quantum mechanical treatment of rotational fine structure is the same as for pure rotation.
The strength of an absorption line is related to the number of molecules with the initial values of the vibrational quantum number ν and the rotational quantum number , and depends on temperature. Since there are actually states with rotational quantum number , the population with value increases with initially, and then decays at higher . This gives the characteristic shape of the P and R branches.
A general convention is to label quantities that refer to the vibrational ground and excited states of a transition with double prime and single prime, respectively. For example, the rotational constant for the ground state is written as and that of the excited state as Also, these constants are expressed in the molecular spectroscopist's units of cm−1. so that in this article corresponds to in the definition of rotational constant at Rigid rotor.
طريقة فروق الجمع
Numerical analysis of ro-vibrational spectral data would appear to be complicated by the fact that the wavenumber for each transition depends on two rotational constants, and . However combinations which depend on only one rotational constant are found by subtracting wavenumbers of pairs of lines (one in the P-branch and one in the R-branch) which have either the same lower level or the same upper level.[2][3] For example, in a diatomic molecule the line denoted P(J + 1) is due to the transition (v = 0, J + 1) → (v = 1, J) (meaning a transition from the state with vibrational quantum number ν going from 0 to 1 and the rotational quantum number going from some value J + 1 to J, with J > 0), and the line R(J − 1) is due to the transition (v = 0, J − 1) → (v = 1, J). The difference between the two wavenumbers corresponds to the energy difference between the (J + 1) and (J − 1) levels of the lower vibrational state and is denoted by since it is the difference between levels differing by two units of J. If centrifugal distortion is included, it is given by[4]
where means the frequency (or wavenumber) of the given line. The main term, comes from the difference in the energy of the rotational state, and that of the state,
The rotational constant of the ground vibrational state B′′ and centrifugal distortion constant, D′′ can be found by least-squares fitting this difference as a function of J. The constant B′′ is used to determine the internuclear distance in the ground state as in pure rotational spectroscopy. (See Appendix)
Similarly the difference R(J) − P(J) depends only on the constants B′ and D′ for the excited vibrational state (v = 1), and B′ can be used to determine the internuclear distance in that state (which is inaccessible to pure rotational spectroscopy).
الجزيئات الخطية
الجزيئات ثنائية الذرات متغايرة النوى
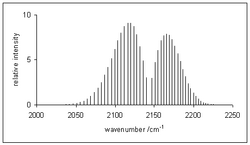
Diatomic molecules with the general formula AB have one normal mode of vibration involving stretching of the A-B bond. The vibrational term values ,[note 3] for an anharmonic oscillator are given, to a first approximation, by
where v is a vibrational quantum number, ωe is the harmonic wavenumber and χe is an anharmonicity constant.
When the molecule is in the gas phase, it can rotate about an axis, perpendicular to the molecular axis, passing through the centre of mass of the molecule. The rotational energy is also quantized, with term values to a first approximation given by
where J is a rotational quantum number and D is a centrifugal distortion constant. The rotational constant, Bv depends on the moment of inertia of the molecule, Iv, which varies with the vibrational quantum number, v
where mA and mB are the masses of the atoms A and B, and d represents the distance between the atoms. The term values of the ro-vibrational states are found (in the Born–Oppenheimer approximation) by combining the expressions for vibration and rotation.
The first two terms in this expression correspond to a harmonic oscillator and a rigid rotor, the second pair of terms make a correction for anharmonicity and centrifugal distortion. A more general expression was given by Dunham.
The selection rule for electric dipole allowed ro-vibrational transitions, in the case of a diamagnetic diatomic molecule is
The transition with Δv=±1 is known as the fundamental transition. The selection rule has two consequences.
- Both the vibrational and rotational quantum numbers must change. The transition : (Q-branch) is forbidden
- The energy change of rotation can be either subtracted from or added to the energy change of vibration, giving the P- and R- branches of the spectrum, respectively.
The calculation of the transition wavenumbers is more complicated than for pure rotation because the rotational constant Bν is different in the ground and excited vibrational states. A simplified expression for the wavenumbers is obtained when the centrifugal distortion constants and are approximately equal to each other.[5]
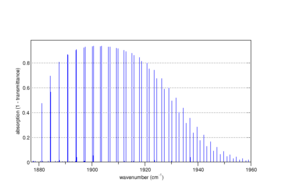
where positive m values refer to the R-branch and negative values refer to the P-branch. The term ω0 gives the position of the (missing) Q-branch, the term implies an progression of equally spaced lines in the P- and R- branches, but the third term, shows that the separation between adjacent lines changes with changing rotational quantum number. When is greater than , as is usually the case, as J increases the separation between lines decreases in the R-branch and increases in the P-branch. Analysis of data from the infrared spectrum of carbon monoxide, gives value of of 1.915 cm−1 and of 1.898 cm−1. The bond lengths are easily obtained from these constants as r0 = 113.3 pm, r1 = 113.6 pm.[7] These bond lengths are slightly different from the equilibrium bond length. This is because there is zero-point energy in the vibrational ground state, whereas the equilibrium bond length is at the minimum in the potential energy curve. The relation between the rotational constants is given by
where ν is a vibrational quantum number and α is a vibration-rotation interaction constant which can be calculated when the B values for two different vibrational states can be found. For carbon monoxide req = 113.0 pm.[8]
Nitric oxide, NO, is a special case as the molecule is paramagnetic, with one unpaired electron. Coupling of the electron spin angular momentum with the molecular vibration causes lambda-doubling[note 5] with calculated harmonic frequencies of 1904.03 and 1903.68 cm−1. Rotational levels are also split.[9]
الجزيئات ثنائية الذرات متماثلة النوى
The quantum mechanics for homonuclear diatomic molecules such as dinitrogen, N2, and fluorine, F2, is qualitatively the same as for heteronuclear diatomic molecules, but the selection rules governing transitions are different. Since the electric dipole moment of the homonuclear diatomics is zero, the fundamental vibrational transition is electric-dipole-forbidden and the molecules are infrared inactive.[10] However, a weak quadrupole-allowed spectrum of N2 can be observed when using long path-lengths both in the laboratory and in the atmosphere.[11] The spectra of these molecules can be observed by Raman spectroscopy because the molecular vibration is Raman-allowed.
Dioxygen is a special case as the molecule is paramagnetic so magnetic-dipole-allowed transitions can be observed in the infrared.[11] The unit electron spin has three spatial orientations with respect to the molecular rotational angular momentum vector, N,[note 6] so that each rotational level is split into three states with total angular momentum (molecular rotation plus electron spin) , J = N + 1, N, and N - 1, each J state of this so-called p-type triplet arising from a different orientation of the spin with respect to the rotational motion of the molecule.[12] Selection rules for magnetic dipole transitions allow transitions between successive members of the triplet (ΔJ = ±1) so that for each value of the rotational angular momentum quantum number N there are two allowed transitions. The 16O nucleus has zero nuclear spins angular momentum, so that symmetry considerations demand that N may only have odd values.[13][14]
أطياف رامان للجزيئات ثنائية الذرات
The selection rule is
so that the spectrum has an O-branch (∆J = −2), a Q-branch (∆J = 0) and an S-branch (∆J=+2). In the approximation that B′′ = B′ = B the wavenumbers are given by
since the S-branch starts at J=0 and the O-branch at J=2. So, to a first approximation, the separation between S(0) and O(2) is 12B and the separation between adjacent lines in both O- and S- branches is 4B. The most obvious effect of the fact that B′′ ≠ B′ is that the Q-branch has a series of closely spaced side lines on the low-frequency side due to transitions in which ΔJ=0 for J=1,2 etc.[15] Useful difference formulae, neglecting centrifugal distortion are as follows.[16]
Molecular oxygen is a special case as the molecule is paramagnetic, with two unpaired electrons.[17]
For homonuclear diatomics, nuclear spin statistical weights lead to alternating line intensities between even- and odd- levels. For nuclear spin I = 1/2 as in 1H2 and 19F2 the intensity alternation is 1:3. For 2H2 and 14N2, I=1 and the statistical weights are 6 and 3 so that the even- levels are twice as intense. For 16O2 (I=0) all transitions with even values of are forbidden.[16]
. . . . . . . . . . . . . . . . . . . . . . . . . . . . . . . . . . . . . . . . . . . . . . . . . . . . . . . . . . . . . . . . . . . . . . . . . . . . . . . . . . . . . . . . . . . . . . . . . . . . . . . . . . . . . . . . . . . . . . . . . . . . . . . . . . . . . . . . . . . . . . . . . . . . . . . . . . . . . . . . . . . . . . . .
الجزيئات الخطية عديدة الذرات
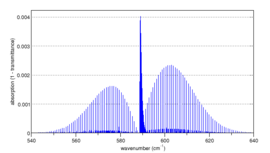 Spectrum of bending mode in 14N14N16O simulated with Spectralcalc.[6] The weak superimposed spectrum is due to species containing 15N at natural abundance of 0.3% |
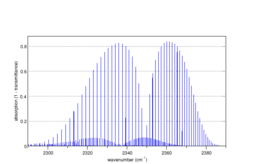 Spectrum of the asymmetric stretching (parallel) band of carbon dioxide, 12C16O2 simulated with Spectralcalc.[6] The weak superimposed spectrum is due to absorption of the first vibrationally excited level (0 11 0), which due to its low energy is populated at room temperature |
These molecules fall into two classes, according to symmetry: centrosymmetric molecules with point group D∞h, such as carbon dioxide, CO2, and ethyne or acetylene, HCCH; and non-centrosymmetric molecules with point group C∞v such as hydrogen cyanide, HCN, and nitrous oxide, NNO. Centrosymmetric linear molecules have a dipole moment of zero, so do not show a pure rotation spectrum in the infrared or microwave regions. On the other hand, in certain vibrational excited states the molecules do have a dipole moment so that a ro-vibrational spectrum can be observed in the infrared.
The spectra of these molecules are classified according to the direction of the dipole moment change vector. When the vibration induces a dipole moment change pointing along the molecular axis the term parallel is applied, with the symbol . When the vibration induces a dipole moment pointing perpendicular to the molecular axis the term perpendicular is applied, with the symbol . In both cases the P- and R- branch wavenumbers follow the same trend as in diatomic molecules. The two classes differ in the selection rules that apply to ro-vibrational transitions.[18] For parallel transitions the selection rule is the same as for diatomic molecules, namely, the transition corresponding to the Q-branch is forbidden. An example is the C-H stretching mode of hydrogen cyanide.[19]
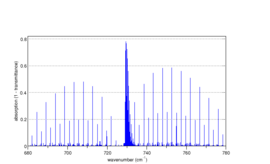
For a perpendicular vibration the transition ΔJ=0 is allowed. This means that the transition is allowed for the molecule with the same rotational quantum number in the ground and excited vibrational state, for all the populated rotational states. This makes for an intense, relatively broad, Q-branch consisting of overlapping lines due to each rotational state. The N-N-O bending mode of nitrous oxide, at ca. 590 cm−1 is an example.[6]
The spectra of centrosymmetric molecules exhibit alternating line intensities due to quantum state symmetry effects, since rotation of the molecule by 180° about a 2-fold rotation axis is equivalent to exchanging identical nuclei. In carbon dioxide, the oxygen atoms of the predominant isotopic species 12C16O2 have spin zero and are bosons, so that the total wavefunction must be symmetric when the two 16O nuclei are exchanged. The nuclear spin factor is always symmetric for two spin-zero nuclei, so that the rotational factor must also be symmetric which is true only for even-J levels. The odd-J rotational levels cannot exist and the allowed vibrational bands consist of only absorption lines from even-J initial levels. The separation between adjacent lines in the P- and R- branches is close to 4B rather than 2B as alternate lines are missing.[20] For acetylene the hydrogens of 1H12C12C1H have spin-1/2 and are fermions, so the total wavefunction is antisymmetric when two 1H nuclei are exchanged. As is true for ortho and para hydrogen the nuclear spin function of the two hydrogens has three symmetric ortho states and one antisymmetric para states. For the three ortho states, the rotational wave function must be antisymmetric corresponding to odd J, and for the one para state it is symmetric corresponding to even J. The population of the odd J levels are therefore three times higher than the even J levels, and alternate line intensities are in the ratio 3:1.[21][22]
الجزيئات العليا الكـُرِّية
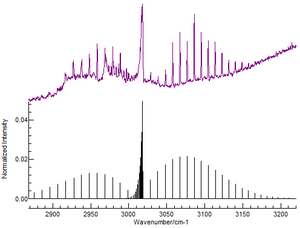
These molecules have equal moments of inertia about any axis, and belong to the point groups Td (tetrahedral AX4) and Oh (octahedral AX6). Molecules with these symmetries have a dipole moment of zero, so do not have a pure rotation spectrum in the infrared or microwave regions.[24]
Tetrahedral molecules such as methane, CH4, have infrared-active stretching and bending vibrations, belonging to the T2 (sometimes written as F2) representation.[note 7] These vibrations are triply degenerate and the rotational energy levels have three components separated by the Coriolis interaction.[25] The rotational term values are given, to a first order approximation, by[26]
where is a constant for Coriolis coupling. The selection rule for a fundamental vibration is
Thus, the spectrum is very much like the spectrum from a perpendicular vibration of a linear molecule, with a strong Q-branch composed of many transitions in which the rotational quantum number is the same in the vibrational ground and excited states, The effect of Coriolis coupling is clearly visible in the C-H stretching vibration of methane, though detailed study has shown that the first-order formula for Coriolis coupling, given above, is not adequate for methane.[27][28][29]
الجزيئات العليا المتناظرة
These molecules have a unique principal rotation axis of order 3 or higher. There are two distinct moments of inertia and therefore two rotational constants. For rotation about any axis perpendicular to the unique axis, the moment of inertia is and the rotational constant is , as for linear molecules. For rotation about the unique axis, however, the moment of inertia is and the rotational constant is . Examples include ammonia, NH3 and methyl chloride, CH3Cl (both of molecular symmetry described by point group C3v), boron trifluoride, BF3 and phosphorus pentachloride, PCl5 (both of point group D3h), and benzene, C6H6 (point group D6h).
For symmetric rotors a quantum number J is associated with the total angular momentum of the molecule. For a given value of J, there is a 2J+1- fold degeneracy with the quantum number, M taking the values +J ...0 ... -J. The third quantum number, K is associated with rotation about the principal rotation axis of the molecule. As with linear molecules, transitions are classified as parallel, or perpendicular,, in this case according to the direction of the dipole moment change with respect to the principal rotation axis. A third category involves certain overtones and combination bands which share the properties of both parallel and perpendicular transitions. The selection rules are
- If K ≠ 0, then ΔJ = 0, ±1 and ΔK = 0
- If K = 0, then ΔJ = ±1 and ΔK = 0
- ΔJ = 0, ±1 and ΔK = ±1
The fact that the selection rules are different is the justification for the classification and it means that the spectra have a different appearance which can often be immediately recognized. An expression for the calculated wavenumbers of the P- and R- branches may be given as[30]
in which m = J+1 for the R-branch and -J for the P-branch. The three centrifugal distortion constants , and are needed to fit the term values of each level.[1] The wavenumbers of the sub-structure corresponding to each band are given by
represents the Q-branch of the sub-structure, whose position is given by
- .
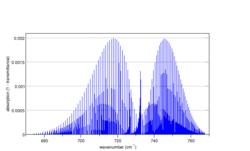 Spectrum of the C-Cl stretching band in CH3Cl (parallel band) simulated with Spectralcalc.[6] |
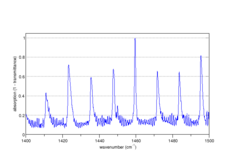 Part of the spectrum of the asymmetric H-C-H bending vibration in CH3Cl (perpendicular band), simulated with Spectralcalc[6] |
الحِزم المتوازية
The C-Cl stretching vibration of methyl chloride, CH3Cl, gives a parallel band since the dipole moment change is aligned with the 3-fold rotation axis. The line spectrum shows the sub-structure of this band rather clearly;[6] in reality, very high resolution spectroscopy would be needed to resolve the fine structure fully. Allen and Cross show parts of the spectrum of CH3D and give a detailed description of the numerical analysis of the experimental data.[31][32]
. . . . . . . . . . . . . . . . . . . . . . . . . . . . . . . . . . . . . . . . . . . . . . . . . . . . . . . . . . . . . . . . . . . . . . . . . . . . . . . . . . . . . . . . . . . . . . . . . . . . . . . . . . . . . . . . . . . . . . . . . . . . . . . . . . . . . . . . . . . . . . . . . . . . . . . . . . . . . . . . . . . . . . . .
الحِزَم المتعامدة
The selection rule for perpendicular bands give rise to more transitions than with parallel bands. A band can be viewed as a series of sub-structures, each with P, Q and R branches. The Q-branches are separated by approximately 2(A′-B′). The asymmetric HCH bending vibration of methyl chloride is typical. It shows a series of intense Q-branches with weak rotational fine structure.[6] Analysis of the spectra is made more complicated by the fact that the ground-state vibration is bound, by symmetry, to be a degenerate vibration, which means that Coriolis coupling also affects the spectrum.[33]
الحِزَم الهجينة
Overtones of a degenerate fundamental vibration have components of more than one symmetry type. For example, the first overtone of a vibration belonging to the E representation in a molecule like ammonia, NH3, will have components belonging to A1 and E representations. A transition to the A1 component will give a parallel band and a transition to the E component will give perpendicular bands; the result is a hybrid band.[34]
الانقلاب في الأمونيا
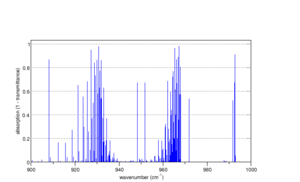 Spectrum of central region of the symmetric bending vibration in ammonia simulated with Spectralcalc,[6] illustrating inversion doubling. |
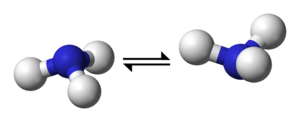
For ammonia, NH3, the symmetric bending vibration is observed as two branches near 930 cm−1 and 965 cm−1. This so-called inversion doubling arises because the symmetric bending vibration is actually a large-amplitude motion known as inversion, in which the nitrogen atom passes through the plane of the three hydrogen atoms, similar to the inversion of an umbrella. The potential energy curve for such a vibration has a double minimum for the two pyramidal geometries, so that the vibrational energy levels occur in pairs which correspond to combinations of the vibrational states in the two potential minima. The two v = 1 states combine to form a symmetric state (1+) at 932.5 cm−1 above the ground (0+) state and an antisymmetric state (1−) at 968.3 cm−1.[35]
The vibrational ground state (v = 0) is also doubled although the energy difference is much smaller, and the transition between the two levels can be measured directly in the microwave region, at ca. 24 GHz (0.8 cm−1).[36][37] This transition is historically significant and was used in the ammonia maser, the fore-runner of the laser.[38]
الجزيئات العليا اللامتناظرة
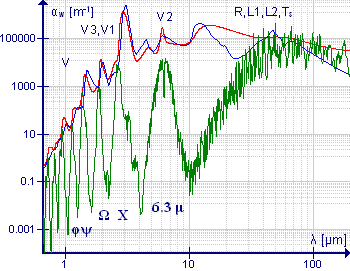
Asymmetric top molecules have at most one or more 2-fold rotation axes. There are three unequal moments of inertia about three mutually perpendicular principal axes. The spectra are very complex. The transition wavenumbers cannot be expressed in terms of an analytical formula but can be calculated using numerical methods.
The water molecule is an important example of this class of molecule, particularly because of the presence of water vapor in the atmosphere. The low-resolution spectrum shown in green illustrates the complexity of the spectrum. At wavelengths greater than 10 μm (or wavenumbers less than 1000 cm−1) the absorption is due to pure rotation. The band around 6.3 μm (1590 cm−1) is due to the HOH bending vibration; the considerable breadth of this band is due to the presence of extensive rotational fine structure. High-resolution spectra of this band are shown in Allen and Cross, p 221.[46] The symmetric and asymmetric stretching vibrations are close to each other, so the rotational fine structures of these bands overlap. The bands at shorter wavelength are overtones and combination bands, all of which show rotational fine structure. Medium resolution spectra of the bands around 1600 cm−1 and 3700 cm−1 are shown in Banwell and McCash, p91.
Ro-vibrational bands of asymmetric top molecules are classed as A-, B- or C- type for transitions in which the dipole moment change is along the axis of smallest moment of inertia to the highest.[47]
الطرق التجريبية
Ro-vibrational spectra are usually measured at high spectral resolution. In the past, this was achieved by using an echelle grating as the spectral dispersion element in a grating spectrometer.[9] This is a type of diffraction grating optimized to use higher diffraction orders.[48] Today at all resolutions the preferred method is FTIR. The primary reason for this is that infrared detectors are inherently noisy, and FTIR detects summed signals at multiple wavelengths simultaneously achieving a higher signal to noise by virtue of Fellgett's advantage for multiplexed methods. The resolving power of an FTIR spectrometer depends on the maximum retardation of the moving mirror. For example, to achieve a resolution of 0.1 cm−1, the moving mirror must have a maximum displacement of 10 cm from its position at zero path difference. Connes measured the vibration-rotation spectrum of Venusian CO2 at this resolution.[49] A spectrometer with 0.001 cm−1 resolution is now available commercially. The throughput advantage of FTIR is important for high-resolution spectroscopy as the monochromator in a dispersive instrument with the same resolution would have very narrow entrance and exit slits.
When measuring the spectra of gases it is relatively easy to obtain very long path-lengths by using a multiple reflection cell.[50] This is important because it allows the pressure to be reduced so as to minimize pressure broadening of the spectral lines, which may degrade resolution. Path lengths up to 20m are commercially available.
ملحق
The method of combination differences uses differences of wavenumbers in the P- and R- branches to obtain data that depend only on rotational constants in the vibrational ground or excited state. For the excited state
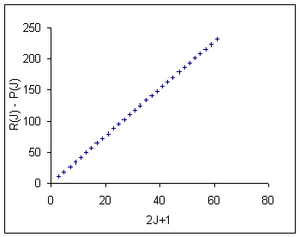
This function can be fitted, using the method of least-squares to data for carbon monoxide, from Harris and Bertolucci.[51] The data calculated with the formula
in which centrifugal distortion is ignored, are shown in the columns labelled with (1). This formula implies that the data should lie on a straight line with slope 2B′′ and intercept zero. At first sight the data appear to conform to this model, with a root mean square residual of 0.21 cm−1. However, when centrifugal distortion is included, using the formula
the least-squares fit is improved markedly, with ms residual decreasing to 0.000086 cm−1. The calculated data are shown in the columns labelled with (2).
| J | 2J+1 | Calculated (1) | Residual (1) | Calculated (2) | Residual (2) | |
|---|---|---|---|---|---|---|
| 1 | 3 | 11.4298 | 11.3877 | 0.0421 | 11.4298 | −0.000040 |
| 2 | 5 | 19.0493 | 18.9795 | 0.0698 | 19.0492 | 0.000055 |
| 3 | 7 | 26.6680 | 26.5713 | 0.0967 | 26.6679 | 0.000083 |
| 4 | 9 | 34.2856 | 34.1631 | 0.1225 | 34.2856 | 0.000037 |
| 5 | 11 | 41.9020 | 41.7549 | 0.1471 | 41.9019 | 0.000111 |
| 6 | 13 | 49.5167 | 49.3467 | 0.1700 | 49.5166 | 0.000097 |
| 7 | 15 | 57.1295 | 56.9385 | 0.1910 | 57.1294 | 0.000089 |
| 8 | 17 | 64.7401 | 64.5303 | 0.2098 | 64.7400 | 0.000081 |
| 9 | 19 | 72.3482 | 72.1221 | 0.2261 | 72.3481 | 0.000064 |
| 10 | 21 | 79.9536 | 79.7139 | 0.2397 | 79.9535 | 0.000133 |
| 11 | 23 | 87.5558 | 87.3057 | 0.2501 | 87.5557 | 0.000080 |
| 12 | 25 | 95.1547 | 94.8975 | 0.2572 | 95.1546 | 0.000100 |
| 13 | 27 | 102.7498 | 102.4893 | 0.2605 | 102.7498 | −0.000016 |
| 14 | 29 | 110.3411 | 110.0811 | 0.2600 | 110.3411 | 0.000026 |
| 15 | 31 | 117.9280 | 117.6729 | 0.2551 | 117.9281 | −0.000080 |
| 16 | 33 | 125.5105 | 125.2647 | 0.2458 | 125.5105 | −0.000041 |
| 17 | 35 | 133.0882 | 132.8565 | 0.2317 | 133.0882 | 0.000035 |
| 18 | 37 | 140.6607 | 140.4483 | 0.2124 | 140.6607 | 0.000043 |
| 19 | 39 | 148.2277 | 148.0401 | 0.1876 | 148.2277 | −0.000026 |
| 20 | 41 | 155.7890 | 155.6319 | 0.1571 | 155.7891 | −0.000077 |
| 21 | 43 | 163.3443 | 163.2237 | 0.1206 | 163.3444 | −0.000117 |
| 22 | 45 | 170.8934 | 170.8155 | 0.0779 | 170.8935 | −0.000053 |
| 23 | 47 | 178.4358 | 178.4073 | 0.0285 | 178.4359 | −0.000093 |
| 24 | 49 | 185.9713 | 185.9991 | −0.0278 | 185.9714 | −0.000142 |
| 25 | 51 | 193.4997 | 193.5909 | −0.0912 | 193.4998 | −0.000107 |
| 26 | 53 | 201.0206 | 201.1827 | −0.1621 | 201.0207 | −0.000097 |
| 27 | 55 | 208.5338 | 208.7745 | −0.2407 | 208.5338 | −0.000016 |
| 28 | 57 | 216.0389 | 216.3663 | −0.3274 | 216.0389 | 0.000028 |
| 20 | 59 | 223.5357 | 223.9581 | −0.4224 | 223.5356 | 0.000128 |
| 30 | 61 | 231.0238 | 231.5499 | −0.5261 | 231.0236 | 0.000178 |
ملاحظات
- ^ Traditionally, infrared spectra are shown with the wavenumber scale decreasing from left to right, corresponding to increasing wavelength. More modern texts may show the wavenumber scale increasing from left to right. The P-branch is always at lower wavenumbers than the Q-branch.
- ^ Observed spectra of the fundamental band (shown here) and the first overtone band (for double excitation near 2 × 2140 cm−1) can be seen in Banwell and McCash, p 67
- ^ Term value is directly related to energy by
- ^ Transitions with ∆v≠1 are called overtones. They are forbidden in the harmonic approximation but can be observed as weak bands because of anharmonicity.
- ^ Another example of lambda-doubling is found in the energy levels of the hydroxyl radical.
- ^ Some texts use the symbol K for this quantum number
- ^ The term representation is used in group theory to classify the effect of symmetry operations on, in this case, a molecular vibration. The symbols for the representations are to be found in the first column of the character table that applies to the particular molecular symmetry.
المراجع
- ^ أ ب Hollas p101
- ^ Hollas p132
- ^ Atkins and de Paula p458 with diagrams
- ^ Allen and Cross, p 116
- ^ Allen and Cross, p113
- ^ أ ب ت ث ج ح خ د ذ ر Simulated spectrum created using infrared gas spectra simulator
- ^ Banwell and McCash, p 70
- ^ Banwell and McCash, p69
- ^ أ ب Gillette, R. H.; Eyster,Eugene H. (1939). "The Fundamental Rotation-Vibration Band of Nitric Oxide". Phys. Rev. 56 (11): 1113–1119. Bibcode:1939PhRv...56.1113G. doi:10.1103/PhysRev.56.1113.
- ^ Atkins, Peter; de Paula, Julio (2006). Atkins' Physical Chemistry (8th ed.). New York: W.H.Freeman. p. 454. ISBN 0-7167-8759-8.
- ^ أ ب Goldman, A.; Reid, J.; Rothman, L. S. (1981). "Identification of electric quadrupole O2 and N2 lines in the infrared atmospheric absorption spectrum due to the vibration‐rotation fundamentals". Geophysical Research Letters. 8 (1): 77. Bibcode:1981GeoRL...8...77G. doi:10.1029/GL008i001p00077.
- ^ Hollas p116
- ^ Strandberg, M. W. P.; Meng, C. Y.; Ingersoll, J. G. (1949). "The Microwave Absorption Spectrum of Oxygen". Phys. Rev. 75 (10): 1524–1528. Bibcode:1949PhRv...75.1524S. doi:10.1103/PhysRev.75.1524.pdf
- ^ Krupenie, Paul H. (1972). "The Spectrum of Molecular Oxygen" (PDF). J. Phys. Chem. Ref. Data. 1 (2): 423–534. Bibcode:1972JPCRD...1..423K. doi:10.1063/1.3253101. Archived from the original (PDF) on 2016-03-04.
- ^ Hollas, pp 133–135. The Stokes-side spectrum of carbon monoxide is shown on p134
- ^ أ ب Hollas, p135
- ^ Fletcher, William H.; Rayside, John S. (1974). "High resolution vibrational Raman spectrum of oxygen". Journal of Raman Spectroscopy. 2 (1): 3–14. Bibcode:1974JRSp....2....3F. doi:10.1002/jrs.1250020102.
- ^ Straughan and Walker, vol2, p185
- ^ The spectrum of this vibration mode, centered at ca. 3310 cm−1 is shown in Banwell and McCash, p76, and also in Hollas, p156
- ^ Straughan and Walker, vol2 p186
- ^ Hollas p155
- ^ Straughan and Walker vol2, pp 186−8
- ^ Western, Colin. "PGOPHER, a program for rotational, vibrational and electronic spectra". pgopher.chm.bris.ac.uk.
- ^ A very weak spectrum can be observed due to an excited vibrational state being polar. See rotational spectroscopy for more details.
- ^ Straughan and Walker vol2, p199
- ^ Allen and Cross, p67
- ^ Jahn, H. A. (1938). "A New Coriolis Perturbation in the Methane Spectrum. I. Vibrational-Rotational Hamiltonian and Wave Functions". Proceedings of the Royal Society of London. Series A, Mathematical and Physical Sciences. 168 (935): 469–495. Bibcode:1938RSPSA.168..469J. doi:10.1098/rspa.1938.0187. ISSN 0080-4630. JSTOR 97253.
- ^ Jahn, H. A. (1939). "Coriolis Perturbations in the Methane Spectrum. IV. Four General Types of Coriolis Perturbation". Proceedings of the Royal Society of London. Series A, Mathematical and Physical Sciences. 171 (947): 450–468. Bibcode:1939RSPSA.171..450J. doi:10.1098/rspa.1939.0077. ISSN 0080-4630. JSTOR 97293.
- ^ Hecht, K.T. (1960). "Vibration-rotation energies of tetrahedral XY4 molecules: Part II. The fundamental ν3 of CH4" (PDF). J. Mol. Spectrosc. 5 (1–6): 335, 390. Bibcode:1961JMoSp...5..390H. doi:10.1016/0022-2852(61)90103-5. hdl:2027.42/32396.
- ^ Allen and Cross, p131
- ^ Allen and Cross pp 134–148
- ^ Allen, H.C. Jr.; E.K.Pyler (1959). "Some Vibrational-Rotational Bands of Deuterated Methanes". Journal of Research of the National Bureau of Standards Section A. 63A (2): 145–153. doi:10.6028/jres.063a.007. PMC 5287196. PMID 31216145.[1]
- ^ Allen and Cross, pp 149–164 has a detailed analysis.
- ^ Allen and Cross, pp 164–70.
- ^ Hollas p167 gives 0.79 cm−1 for the 0+−0− energy difference, 931.7 cm−1 for 0−−1+, and 35.8 cm−1 for 1+−1−.
- ^ Harris, Daniel, C.; Bertolucci, Michael, D. (1978). Symmetry and Spectroscopy. OUP. pp. 168–170. ISBN 0-19-502001-4.
{{cite book}}: CS1 maint: multiple names: authors list (link) - ^ Spectra are shown in Allen and Cross, pp 172–174
- ^ Straughan and Walker p124
- ^ Bertie J. E.; Lan Z. (1996). "Infrared Intensities of Liquids XX: The Intensity of the OH Stretching Band of Liquid Water Revisited, and the Best Current Values of the Optical Constants of H2O(l) at 25°C between 15,000 and 1 cm−1". Applied Spectroscopy. 50 (8): 1047–1057. Bibcode:1996ApSpe..50.1047B. doi:10.1366/0003702963905385. S2CID 97329854. Retrieved 2012-08-08.
- ^ "Spectroscopy of Atmospheric Gases (spectral databases)". V.E. Zuev Institute of Atmospheric Optics SB RAS. Archived from the original on April 16, 2013. Retrieved August 8, 2012.
... various data sources: HITRAN and GEISA spectral databanks, original data obtained by IAO researchers in collaboration with other scientists, H2O spectra simulated by Partridge and Schwenke etc... ...
- ^ Aringer B.; Kerschbaum F.; Jørgensen U. G. (2002). "H2O in stellar atmospheres" (PDF). Astronomy and Astrophysics. EDP Sciences. 395 (3): 915–927. Bibcode:2002A&A...395..915A. doi:10.1051/0004-6361:20021313. Retrieved 2012-08-08.
- ^ Warren S. G. (1984). "Optical constants of ice from the ultraviolet to the microwave" (PDF). Applied Optics. 23 (8): 1206. Bibcode:1984ApOpt..23.1206W. doi:10.1364/AO.23.001206. PMID 18204705. Retrieved 2012-08-08.
- ^ Warren S. G.; Brandt R. E. (2008). "Optical constants of ice from the ultraviolet to the microwave: A revised compilation" (PDF). J. Geophys. Res. 113 (D14): D14220. Bibcode:2008JGRD..11314220W. doi:10.1029/2007JD009744. Retrieved 2012-08-08.
- ^ Wozniak B.; Dera J. (2007). Atmospheric and Oceanographic Sciences Library (PDF). New York: Springer Science+Business Media. LLC. ISBN 978-0-387-30753-4. Retrieved August 4, 2012.
- ^ "Hitran on the Web Information System". Harvard-Smithsonian Center for Astrophysics (CFA), Cambridge, MA, USA; V.E. Zuev Institute of Atmosperic Optics (IAO), Tomsk, Russia. Retrieved August 11, 2012.
- ^ Dalby, F.W.; Nielsen, H.H. (1956). "Infrared Spectrum of Water Vapor. Part I—The 6.26μ Region". J. Chem. Phys. 25 (5): 934–940. Bibcode:1956JChPh..25..934D. doi:10.1063/1.1743146.
- ^ Allen and Cross, chapter 8.
- ^ Hollas, pp. 38−41. Worked Example 3.1 shows how resolving power is related to diffraction order and line spacing on the grating
- ^ Connes, J.; Connes, P. (1966). "Near-Infrared Planetary Spectra by Fourier Spectroscopy. I. Instruments and Results". Journal of the Optical Society of America. 56 (7): 896–910. doi:10.1364/JOSA.56.000896.
- ^ Patricia B. Coleman, ed. (1993). Practical Sampling Techniques for Infrared Analysis. CRC PressINC. ISBN 0-8493-4203-1.
- ^ أ ب Harris, Daniel, C.; Bertolucci, Michael, D. (1978). Symmetry and Spectroscopy. OUP. p. 125. ISBN 0-19-502001-4.
{{cite book}}: CS1 maint: multiple names: authors list (link)
ببليوجرافيا
- Allen, H.C.; Cross, P.C. (1963). Molecular vib-rotors; the theory and interpretation of high resolution infra-red spectra. New York: Wiley.
- Atkins, P.W.; de Paula, J. (2006). Physical Chemistry (8th ed.). Oxford University Press. pp. 431–469. ISBN 0198700725. Chapter (Molecular Spectroscopy), Section (Vibration-rotation spectra) and page numbers may be different in different editions.
- Banwell, Colin N.; McCash, Elaine M. (1994). Fundamentals of molecular spectroscopy (4th ed.). McGraw-Hill. p. 40. ISBN 0-07-707976-0.
- Hollas, M.J. (1996). Modern Spectroscopy (3rd ed.). Wiley. ISBN 0471965227.
- Straughan, B.P.; Walker, S. (1976). Spectroscopy. Vol. 2 (3rd ed.). Chapman and Hall. pp. 176–204. ISBN 0-470-15032-7.




![{\displaystyle G(v)+F_{v}(J)=\left[\omega _{e}\left(v+{1 \over 2}\right)+B_{v}J(J+1)\right]-\left[\omega _{e}\chi _{e}\left(v+{1 \over 2}\right)^{2}+DJ^{2}(J+1)^{2}\right]}](https://www.marefa.org/api/rest_v1/media/math/render/svg/f29b6ce6939eaa21021fb6adaa4da9c931b66b29)


![{\displaystyle \Delta _{4}^{\prime \prime }F(J)={\bar {\nu }}[S(J-2)]-{\bar {\nu }}[O(J+2)]=4B^{\prime \prime }(2J+1)}](https://www.marefa.org/api/rest_v1/media/math/render/svg/97bdc201a98a091e3c261cacc3c829555b0d1a26)
![{\displaystyle \Delta _{4}^{\prime }F(J)={\bar {\nu }}[S(J)]-{\bar {\nu }}[O(J)]=4B^{\prime }(2J+1)}](https://www.marefa.org/api/rest_v1/media/math/render/svg/c66b8555346364f27f93a21c53b86a1cdb201c4e)



![{\displaystyle +\left\{\left[(A^{\prime }-B^{\prime })-(A^{\prime \prime }-B^{\prime \prime })\right]-\left[D_{JK}^{\prime }+D_{JK}^{\prime \prime }\right]m-\left[D_{JK}^{\prime }-D_{JK}^{\prime \prime }\right]m^{2}\right\}K^{2}-(D_{K}^{\prime }-D_{K}^{\prime \prime })K^{4}}](https://www.marefa.org/api/rest_v1/media/math/render/svg/6e4546c182830b57eaf498de8ddb8ac167d3c059)


![{\displaystyle {\bar {\nu }}_{sub}={\bar {\nu }}_{0}+\left[(A^{\prime }-B^{\prime })-(A^{\prime \prime }-B^{\prime \prime })\right]K^{2}-(D_{K}^{\prime }-D_{K}^{\prime \prime })K^{4}}](https://www.marefa.org/api/rest_v1/media/math/render/svg/3b449c465c33cdb5fc19d87918f0b67811c0982c)
![{\displaystyle \Delta _{2}^{\prime }F(J)^{observed}={\bar {\nu }}[R(J)]-{\bar {\nu }}[P(J)]}](https://www.marefa.org/api/rest_v1/media/math/render/svg/da548317a3d8470f63057a9fc8cf45dce0e74b61)


