مرسمة كهربائية القلب

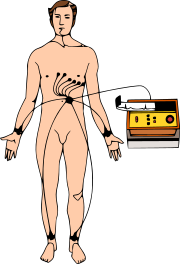
مرسمة كهربائية القلب Electrocardiography جهاز قياس يستخدم لتشخيص اضطرابات القلب. ففي كل مرة يدق فيها القلب تنتج تيارات كهربائية. وتلتقط مرسمة كهربائية القلب هذه التيارات وتسجلها على ورق. ويسمى هذا التسجيل رسم كهربائية القلب، ويمكن توصيل المرسمة إلى راسمة ذبذبات وهي جهاز قياس يعرض التيارات على شاشة تلفازية.تحتوي مرسمة كهربائية القلب على معدات تكبير وتسجيل. وتمر الأسلاك من المرسمة إلى أقطاب كهربائية، وهي شرائط فلزية موصلة للكهرباء. ويسجل رسم كهربائية القلب بإلصاق الأقطاب الكهربائية بجلد المريض بوساطة مادة هلامية خاصة. وتوضع الأقطاب على كل ذراع وساق وعند ستّ نقاط على الصدر، فوق منطقة القلب.
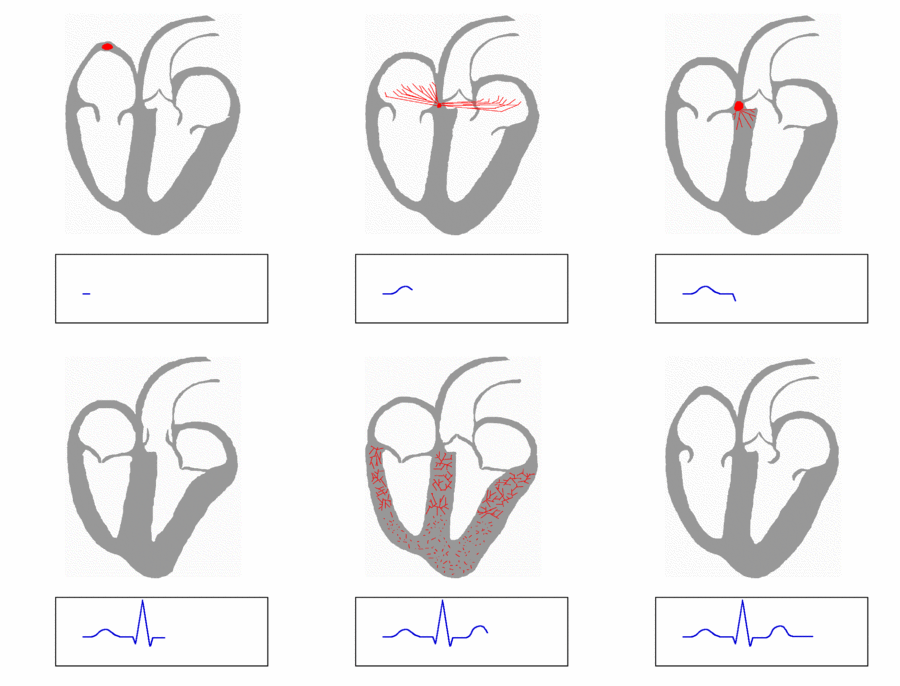
وتقوم الأقطاب بالتقاط التيارات التي ينتجها القلب عند كل خفقة من خفقاته، وتنقلها إلى مكبر داخل مرسمة القلب. تنساب التيارات المكبرة بعد ذلك خلال ملف من سلك رفيع جدًا معلق داخل مجال مغنطيسي، ويتحرك السلك بسبب تفاعل هذه التيارات مع المجال المغنطيسي. وتقوم رافعة حساسة بتسجيل حركة السلك على ورق رسم بياني متحرك فينتج عن ذلك رسم كهربائية القلب. تنتج كل نبضة قلب سلسلة من الخطوط الموجية. ويعطي النبض الطبيعي للقلب نموذجًا موجيًا محددًا. وتغير أنواع معينة من أمراض القلب هذا النموذج المعروف على نحو يمكن التعرف عليه.

| Electrode label (in the USA) | Electrode placement |
|---|---|
| RA | On the right arm, avoiding bony prominences. |
| LA | In the same location that RA was placed, but on the left arm this time. |
| RL | On the right leg, avoiding bony prominences. |
| LL | In the same location that RL was placed, but on the left leg this time. |
| V1 | In the fourth intercostal space (between ribs 4 & 5) just to the right of the sternum (breastbone). |
| V2 | In the fourth intercostal space (between ribs 4 & 5) just to the left of the sternum. |
| V3 | Between leads V2 and V4. |
| V4 | In the fifth intercostal space (between ribs 5 & 6) in the mid-clavicular line (the imaginary line that extends down from the midpoint of the clavicle (collarbone)). |
| V5 | Horizontally even with V4, but in the anterior axillary line. (The anterior axillary line is the imaginary line that runs down from the point midway between the middle of the clavicle and the lateral end of the clavicle; the lateral end of the collarbone is the end closer to the arm.) |
| V6 | Horizontally even with V4 and V5 in the midaxillary line. (The midaxillary line is the imaginary line that extends down from the middle of the patient's armpit.) |
. . . . . . . . . . . . . . . . . . . . . . . . . . . . . . . . . . . . . . . . . . . . . . . . . . . . . . . . . . . . . . . . . . . . . . . . . . . . . . . . . . . . . . . . . . . . . . . . . . . . . . . . . . . . . . . . . . . . . . . . . . . . . . . . . . . . . . . . . . . . . . . . . . . . . . . . . . . . . . . . . . . . . . . .
الإستخدامات
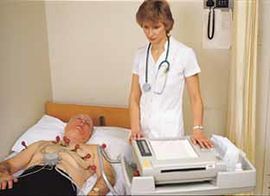
يستخدم الأطباء مرسمة كهربائية القلب في تشخيص أمراض القلب الناتجة عن ارتفاع ضغط الدم والحمى الروماتزمية والعيوب الولادية. وغالبًا ما يؤخذ رسم كهربائية القلب والمريض مُسْتَلْق على الفراش. ويسمى هذا الأسلوب رسم كهربائية القلب عند الراحة. وقد تؤخذ هذه الصورة أثناء قيام المريض بمجهود، ويسمى هذا الاختبار رسم كهربائية القلب عند الإجهاد. وهو يبين ما إذا كان القلب يتلقى كمية كافية من الأكسجين أثناء النشاط العنيف. يستخدم الأطباء رسم كهربائية القلب عند الإجهاد في تشخيص مرض الشرايين التاجية الذي تكون فيه الشرايين التي تغذي عضلة القلب قد ضاقت إلى حد خطير بحيث تحد من سريان الدم.
تاريخ
تم اختراع مرسمة كهربائية القلب المطورة من المقياس الجلفاني الخيطي في سنة 1903م بوساطة عالم وظائف الأعضاء الهولندي فيلم أينتهوفن.
| Feature | Description | Duration |
|---|---|---|
| RR interval | The interval between an R wave and the next R wave is the inverse of the heart rate. Normal resting heart rate is between 50 and 100 bpm | 0.6 to 1.2s |
| P wave | During normal atrial depolarization, the main electrical vector is directed from the SA node towards the AV node, and spreads from the right atrium to the left atrium. This turns into the P wave on the ECG. | 80ms |
| PR interval | The PR interval is measured from the beginning of the P wave to the beginning of the QRS complex. The PR interval reflects the time the electrical impulse takes to travel from the sinus node through the AV node and entering the ventricles. The PR interval is therefore a good estimate of AV node function. | 120 to 200ms |
| PR segment | The PR segment connects the P wave and the QRS complex. This coincides with the electrical conduction from the AV node to the bundle of His to the bundle branches and then to the Purkinje Fibers. This electrical activity does not produce a contraction directly and is merely traveling down towards the ventricles and this shows up flat on the ECG. The PR interval is more clinically relevant. | 50 to 120ms |
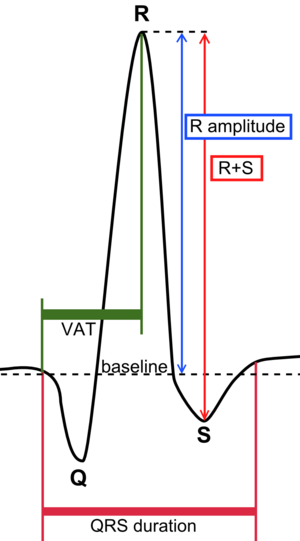
| QRS complex | The QRS complex reflects the rapid depolarization of the right and left ventricles. They have a large muscle mass compared to the atria and so the QRS complex usually has a much larger amplitude than the P-wave. | 80 to 120ms |
| J-point | The point at which the QRS complex finishes and the ST segment begins. Used to measure the degree of ST elevation or depression present. | N/A |
| ST segment | The ST segment connects the QRS complex and the T wave. The ST segment represents the period when the ventricles are depolarized. It is isoelectric. | 80 to 120ms |
| T wave | The T wave represents the repolarization (or recovery) of the ventricles. The interval from the beginning of the QRS complex to the apex of the T wave is referred to as the absolute refractory period. The last half of the T wave is referred to as the relative refractory period (or vulnerable period). | 160ms |
| ST interval | The ST interval is measured from the J point to the end of the T wave. | 320ms |
| QT interval | The QT interval is measured from the beginning of the QRS complex to the end of the T wave. A prolonged QT interval is a risk factor for ventricular tachyarrhythmias and sudden death. It varies with heart rate and for clinical relevance requires a correction for this, giving the QTc. | 300 to 430ms[بحاجة لمصدر] |
| U wave | The U wave is not always seen. It is typically low amplitude, and, by definition, follows the T wave. | |
| J wave | The J wave, elevated J-Point or Osborn Wave appears as a late delta wave following the QRS or as a small secondary R wave . It is considered pathognomic of hypothermia or hypocalcemia.[2] |
| Normal | −30° to 90° | Normal | Normal |
| Left axis deviation | −30° to −90° | May indicate left anterior fascicular block or Q waves from inferior MI. | Left axis deviation is considered normal in pregnant women and those with emphysema. |
| Right axis deviation | +90° to +180° | May indicate left posterior fascicular block, Q waves from high lateral MI, or a right ventricular strain pattern. | Right deviation is considered normal in children and is a standard effect of dextrocardia. |
| Extreme right axis deviation | +180° to −90° | Is rare, and considered an 'electrical no-man's land'. |
| Category | Color on chart | Leads | Activity |
|---|---|---|---|
| Inferior leads | Yellow | Leads II, III and aVF | Look at electrical activity from the vantage point of the inferior surface (diaphragmatic surface of heart). |
| Lateral leads | Green | I, aVL, V5 and V6 | Look at the electrical activity from the vantage point of the lateral wall of left ventricle.
|
| Septal leads | Orange | V1 and V2 | Look at electrical activity from the vantage point of the septal wall of the ventricles (interventricular septum). |
| Anterior leads | Blue | V3 and V4 | Look at electrical activity from the vantage point of the anterior surface of the heart (sternocostal surface of heart). |
| Shortened QT interval | Hypercalcemia, some drugs, certain genetic abnormalities. |
|---|---|
| Prolonged QT interval | Hypocalcemia, some drugs, certain genetic abnormalities. |
| Flattened or inverted T waves | Coronary ischemia, left ventricular hypertrophy, digoxin effect, some drugs. |
| Hyperacute T waves | Possibly the first manifestation of acute myocardial infarction. |
| Prominent U waves | Hypokalemia. |
أنظر أيضاً
المصادر
- ^ [1][dead link]
- ^ Gan-Xin Yan; Charles Antzelevitch. Cellular Basis for the Electrocardiographic J Wave. Circulation. 1996;93:372-379. http://circ.ahajournals.org/cgi/content/full/circulationaha;93/2/372
وصلات خارجية
| ECG
]].- Electrocardiogram, EKG, or ECG – Explanation of what an ECG is, who needs one, what to expect during one, etc. Written by the National Heart Lung and Blood Institute (a division of the NIH)
- University of Maryland School of Medicine Emergency Medicine Interest Group – Introduction to EKGs as written by a medical student and a cardiologist
- ECG in 100 steps: Slideshow
- ECG Lead Placement – A teaching guide "designed for student nurses who know nothing at all about Cardiology"
- ECGpedia: Course for interpretation of ECG
- 12-lead ECG library
- Simulation tool to demonstrate and study the relation between the electric activity of the heart and the ECG
- Minnesota ECG Code
- openECGproject - help develop an open ECG solution
- EKG Review: Arrhythmias – A guide to reading ECGs not written for a university biology (anatomy and physiology) course.


