مخطط فاينمان
في الفيزياء النظرية، مخطط فاينمان Feynman diagram هي تمثيل مصور للتعبيرات الرياضية التي تصف سلوك وتفاعلات الجسيمات دون الذرية. لتسهيل إجراء الحسابات في نظرية الحقل الكمومي، أوجدها الفيزيائي الأمريكي ريتشارد فاينمان في 1948. و تدعي أحيانا بمخططات ستوكيلبرغ أو مخططات البطريق. The interaction of subatomic particles can be complex and difficult to understand; Feynman diagrams give a simple visualization of what would otherwise be an arcane and abstract formula. According to David Kaiser, "Since the middle of the 20th century, theoretical physicists have increasingly turned to this tool to help them undertake critical calculations. Feynman diagrams have revolutionized nearly every aspect of theoretical physics."[1] While the diagrams are applied primarily to quantum field theory, they can also be used in other fields, such as solid-state theory. Frank Wilczek wrote that the calculations which won him the 2004 Nobel Prize in Physics "would have been literally unthinkable without Feynman diagrams, as would [Wilczek's] calculations that established a route to production and observation of the Higgs particle."[2]
Feynman used Ernst Stueckelberg's interpretation of the positron as if it were an electron moving backward in time.[3] Thus, antiparticles are represented as moving backward along the time axis in Feynman diagrams.
The calculation of probability amplitudes in theoretical particle physics requires the use of rather large and complicated integrals over a large number of variables. Feynman diagrams can represent these integrals graphically.
A Feynman diagram is a graphical representation of a perturbative contribution to the transition amplitude or correlation function of a quantum mechanical or statistical field theory. Within the canonical formulation of quantum field theory, a Feynman diagram represents a term in the Wick's expansion of the perturbative S-matrix. Alternatively, the path integral formulation of quantum field theory represents the transition amplitude as a weighted sum of all possible histories of the system from the initial to the final state, in terms of either particles or fields. The transition amplitude is then given as the matrix element of the S-matrix between the initial and final states of the quantum system.
| نظرية الحقل الكمومي |
|---|
 |
| التاريخ |
. . . . . . . . . . . . . . . . . . . . . . . . . . . . . . . . . . . . . . . . . . . . . . . . . . . . . . . . . . . . . . . . . . . . . . . . . . . . . . . . . . . . . . . . . . . . . . . . . . . . . . . . . . . . . . . . . . . . . . . . . . . . . . . . . . . . . . . . . . . . . . . . . . . . . . . . . . . . . . . . . . . . . . . .
الدافع والتاريخ
الوصف

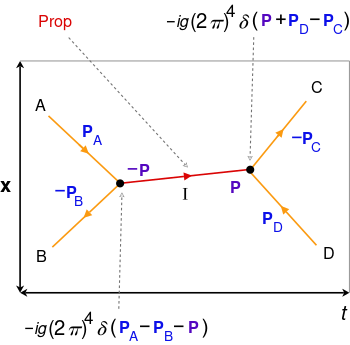
• internal lines (red) for intermediate particles and processes, which has a propagator factor ("prop"), external lines (orange) for incoming/outgoing particles to/from vertices (black),
• at each vertex there is 4-momentum conservation using delta functions, 4-momenta entering the vertex are positive while those leaving are negative, the factors at each vertex and internal line are multiplied in the amplitude integral,
• space x and time t axes are not always shown, directions of external lines correspond to passage of time.
Electron–positron annihilation example
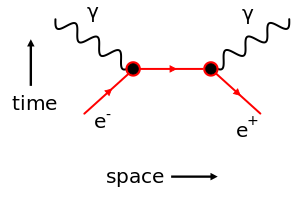
The electron–positron annihilation interaction:
- e+ + e− → 2γ
has a contribution from the second order Feynman diagram shown adjacent:
In the initial state (at the bottom; early time) there is one electron (e−) and one positron (e+) and in the final state (at the top; late time) there are two photons (γ).
Canonical quantization formulation
The probability amplitude for a transition of a quantum system (between asymptotically free states) from the initial state قالب:Ket to the final state قالب:Ket is given by the matrix element
where S is the S-matrix. In terms of the time-evolution operator U, it is simply
In the interaction picture, this expands to
where HV is the interaction Hamiltonian and T signifies the time-ordered product of operators. Dyson's formula expands the time-ordered matrix exponential into a perturbation series in the powers of the interaction Hamiltonian density,
Equivalently, with the interaction Lagrangian LV, it is
A Feynman diagram is a graphical representation of a single summand in the Wick's expansion of the time-ordered product in the nth-order term S(n) of the Dyson series of the S-matrix,
where N signifies the normal-ordered product of the operators and (±) takes care of the possible sign change when commuting the fermionic operators to bring them together for a contraction (a propagator) and A represents all possible contractions.
Feynman rules
The diagrams are drawn according to the Feynman rules, which depend upon the interaction Lagrangian. For the QED interaction Lagrangian
describing the interaction of a fermionic field ψ with a bosonic gauge field Aμ, the Feynman rules can be formulated in coordinate space as follows:
- Each integration coordinate xj is represented by a point (sometimes called a vertex);
- A bosonic propagator is represented by a wiggly line connecting two points;
- A fermionic propagator is represented by a solid line connecting two points;
- A bosonic field is represented by a wiggly line attached to the point xi;
- A fermionic field ψ(xi) is represented by a solid line attached to the point xi with an arrow toward the point;
- An anti-fermionic field ψ(xi) is represented by a solid line attached to the point xi with an arrow away from the point;
Example: second order processes in QED
The second order perturbation term in the S-matrix is
Scattering of fermions
ملف:Feynman-diagram-ee-scattering.png The Feynman diagram of the term |
The Wick's expansion of the integrand gives (among others) the following term
حيث
is the electromagnetic contraction (propagator) in the Feynman gauge. This term is represented by the Feynman diagram at the right. This diagram gives contributions to the following processes:
- e− e− scattering (initial state at the right, final state at the left of the diagram);
- e+ e+ scattering (initial state at the left, final state at the right of the diagram);
- e− e+ scattering (initial state at the bottom/top, final state at the top/bottom of the diagram).
Compton scattering and annihilation/generation of e− e+ pairs
Another interesting term in the expansion is
where
is the fermionic contraction (propagator).
In popular culture
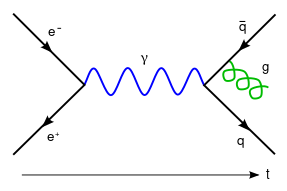
- The use of the above diagram of the virtual particle producing a quark–antiquark pair was featured in the television sit-com The Big Bang Theory, in the episode "The Bat Jar Conjecture".
- PhD Comics of January 11, 2012, shows Feynman diagrams that visualize and describe quantum academic interactions, i.e. the paths followed by Ph.D. students when interacting with their advisors.[4]
- Vacuum Diagrams a science fiction story by Stephen Baxter features the titular vacuum diagram, a specific type of Feynman diagram.
See also
Notes
. . . . . . . . . . . . . . . . . . . . . . . . . . . . . . . . . . . . . . . . . . . . . . . . . . . . . . . . . . . . . . . . . . . . . . . . . . . . . . . . . . . . . . . . . . . . . . . . . . . . . . . . . . . . . . . . . . . . . . . . . . . . . . . . . . . . . . . . . . . . . . . . . . . . . . . . . . . . . . . . . . . . . . . .
References
- ^ Kaiser, David (2005). "Physics and Feynman's Diagrams" (PDF). American Scientist. 93 (2): 156. doi:10.1511/2005.52.957.
- ^ "Why Feynman Diagrams Are So Important". Quanta Magazine (in الإنجليزية). 5 July 2016. Retrieved 2020-06-16.
- ^ Feynman, Richard (1949). "The Theory of Positrons". Physical Review. 76 (6): 749–759. Bibcode:1949PhRv...76..749F. doi:10.1103/PhysRev.76.749.
In this solution, the 'negative energy states' appear in a form which may be pictured (as by Stückelberg) in space-time as waves traveling away from the external potential backwards in time. Experimentally, such a wave corresponds to a positron approaching the potential and annihilating the electron.
- ^ Jorge Cham, Academic Interaction – Feynman Diagrams, January 11, 2012.
Sources
- 't Hooft, Gerardus; Veltman, Martinus (1973). "Diagrammar". CERN Yellow Report. doi:10.5170/CERN-1973-009.
{{cite journal}}: Cite journal requires|journal=(help) - Kaiser, David (2005). Drawing Theories Apart: The Dispersion of Feynman Diagrams in Postwar Physics. Chicago, IL: University of Chicago Press. ISBN 0-226-42266-6.
- Veltman, Martinus (1994-06-16). Diagrammatica: The Path to Feynman Diagrams. Cambridge Lecture Notes in Physics. ISBN 0-521-45692-4. (expanded, updated version of 't Hooft & Veltman, 1973, cited above)
- قالب:Cite work
- Schweber, S. S. (1994). QED and the men who made it: Dyson, Feynman, Schwinger, and Tomonaga. Princeton University Press. ISBN 978-0691033273.
External links
- AMS article: "What's New in Mathematics: Finite-dimensional Feynman Diagrams"
- Draw Feynman diagrams explained by Flip Tanedo at Quantumdiaries.com
- Drawing Feynman diagrams with FeynDiagram C++ library that produces PostScript output.
- Online Diagram Tool A graphical application for creating publication ready diagrams.
- JaxoDraw A Java program for drawing Feynman diagrams.
- Bowley, Roger; Copeland, Ed (2010). "Feynman Diagrams". Sixty Symbols. Brady Haran for the University of Nottingham.


