إپسوم ويـُوِل (دائرة انتخابية في المملكة المتحدة)
| Epsom and Ewell | |
|---|---|
| دائرة انتخابية Borough | |
| لمجلس العموم | |
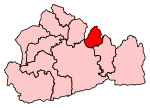
 حدود Epsom and Ewell في Surrey للانتخابات العامة في 2010. | |
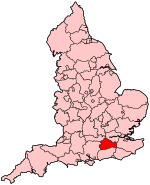
 موقع Surrey ضمن England. | |
| المقاطعة | سري |
| المسجلون | 76,916 (December 2010)[1] |
| المستوطنات الرئيسية | إپسوم, يـُوِل و آشتيد |
| الدائرة الحالية | |
| خُلِقت | 1974 1974 |
| عضو البرلمان | Chris Grayling (حزب المحافظين) |
| عدد الأعضاء | 3 |
| خلقت من | إپسوم |
| تراكب | |
| الدائرة الانتخابية الاوروبية | South East England |
إپسوم ويـُوِل إنگليزية: Epsom and Ewell هي إحدى الدوائر الانتخابية في المملكة المتحدة الممثلة في مجلس العموم في برلمان المملكة المتحدة.
عضو البرلمان الذي يمثلها حالياً هو :Chris Grayling (Con).
. . . . . . . . . . . . . . . . . . . . . . . . . . . . . . . . . . . . . . . . . . . . . . . . . . . . . . . . . . . . . . . . . . . . . . . . . . . . . . . . . . . . . . . . . . . . . . . . . . . . . . . . . . . . . . . . . . . . . . . . . . . . . . . . . . . . . . . . . . . . . . . . . . . . . . . . . . . . . . . . . . . . . . . .
أعضاء البرلمان
| Election | Member[2] | Party | |
|---|---|---|---|
| Feb 1974 | constituency created | ||
| Feb 1974 | Peter Rawlinson | Conservative | |
| 1978 by-election | Sir Archie Hamilton | Conservative | |
| 2001 | Chris Grayling | Conservative | |
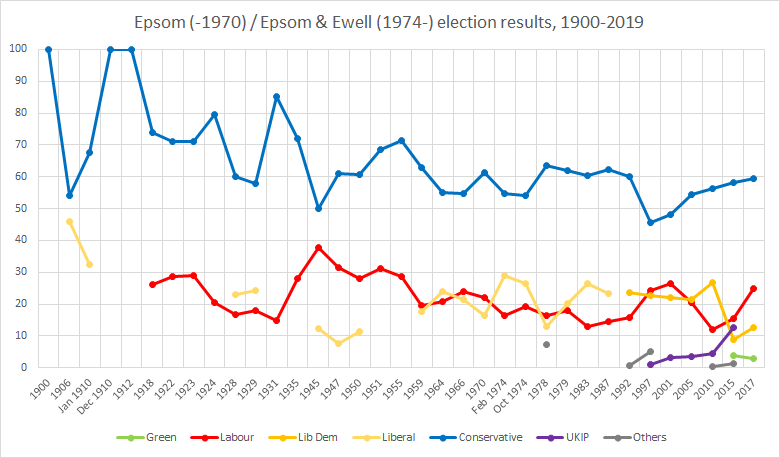
الانتخابات
Elections in the 2010s
| General election 2019: Epsom and Ewell[3] | |||||
|---|---|---|---|---|---|
| الحزب | المرشح | الأصوات | % | ±% | |
| حزب المحافظين | Chris Grayling | 31,819 | 53.5 | ||
| Liberal Democrats | Stephen Gee | 13,946 | 23.5 | ▲11.0 | |
| Labour | Ed Mayne | 10,226 | 17.2 | ||
| Green | Janice Baker | 2,047 | 3.4 | ▲0.6 | |
| Independent | Clive Woodbridge | 1,413 | 2.4 | ▲2.4 | |
| الأغلبية | 17,873 | 30.0 | |||
| الإقبال على الانتخابات | 59,451 | 73.3 | |||
| حزب المحافظين hold | تأرجح | ||||
| General election 2017: Epsom and Ewell[4] | |||||
|---|---|---|---|---|---|
| الحزب | المرشح | الأصوات | % | ±% | |
| Conservative | Chris Grayling | 35,313 | 59.6 | ▲1.3 | |
| Labour | Ed Mayne | 14,838 | 25.0 | ▲9.5 | |
| Liberal Democrats | Stephen Gee | 7,401 | 12.5 | ▲3.7 | |
| Green | Janice Baker | 1,714 | 2.9 | ||
| الأغلبية | 20,475 | 34.5 | |||
| الإقبال على الانتخابات | 59,468 | 74.1 | ▲1.4 | ||
| حزب المحافظين hold | تأرجح | ||||
| General election 2015: Epsom and Ewell[5] | |||||
|---|---|---|---|---|---|
| الحزب | المرشح | الأصوات | % | ±% | |
| Conservative | Chris Grayling | 33,309 | 58.3 | ▲2.1 | |
| Labour | Sheila Carlson | 8,866 | 15.5 | ▲3.6 | |
| UKIP | Robert Leach | 7,117 | 12.5 | ▲7.8 | |
| Liberal Democrats | Stephen Gee | 5,002 | 8.8 | ||
| Green | Susan McGrath | 2,116 | 3.7 | New | |
| Independent | Lionel Blackman | 612 | 1.1 | New | |
| Independent | Gareth Harfoot | 121 | 0.2 | New | |
| الأغلبية | 24,443 | 42.8 | ▲13.4 | ||
| الإقبال على الانتخابات | 57,143 | 72.7 | ▲2.3 | ||
| حزب المحافظين hold | تأرجح | ▲4.1 | |||
| General election 2010: Epsom and Ewell[6] | |||||
|---|---|---|---|---|---|
| الحزب | المرشح | الأصوات | % | ±% | |
| Conservative | Chris Grayling | 30,868 | 56.2 | +1.8 | |
| Liberal Democrats | Jonathan Lees | 14,734 | 26.8 | +5.3 | |
| Labour | Craig Montgomery | 6,538 | 11.9 | -8.1 | |
| UKIP | Elizabeth Wallace | 2,549 | 4.6 | +1.1 | |
| Radical Reform | Peter Ticher | 266 | 0.5 | 0.5 | |
| الأغلبية | 16,134 | 29.4 | -3.6 | ||
| الإقبال على الانتخابات | 54,955 | 70.4 | +4.1 | ||
| حزب المحافظين hold | تأرجح | +4.1 | |||
. . . . . . . . . . . . . . . . . . . . . . . . . . . . . . . . . . . . . . . . . . . . . . . . . . . . . . . . . . . . . . . . . . . . . . . . . . . . . . . . . . . . . . . . . . . . . . . . . . . . . . . . . . . . . . . . . . . . . . . . . . . . . . . . . . . . . . . . . . . . . . . . . . . . . . . . . . . . . . . . . . . . . . . .
Elections in the 2000s
| General election 2005: Epsom and Ewell[7] | |||||
|---|---|---|---|---|---|
| الحزب | المرشح | الأصوات | % | ±% | |
| Conservative | Chris Grayling | 27,146 | 54.4 | +6.3 | |
| Liberal Democrats | Jonathan Lees | 10,699 | 21.4 | -0.7 | |
| Labour | Charlie Mansell | 10,265 | 20.6 | -5.9 | |
| UKIP | Peter Kefford | 1,769 | 3.5 | +0.2 | |
| الأغلبية | 16,447 | 33.0 | |||
| الإقبال على الانتخابات | 49,879 | 66.1 | 3.3 | ||
| حزب المحافظين hold | تأرجح | +3.5 | |||
| General election 2001: Epsom and Ewell[8] | |||||
|---|---|---|---|---|---|
| الحزب | المرشح | الأصوات | % | ±% | |
| Conservative | Chris Grayling | 22,430 | 48.1 | +2.5 | |
| Labour | Charlie Mansell | 12,350 | 26.5 | +2.1 | |
| Liberal Democrats | John Vincent | 10,316 | 22.1 | -0.7 | |
| UKIP | Graham Webster-Gardiner | 1,547 | 3.3 | +2.3 | |
| الأغلبية | 10,080 | 21.6 | |||
| الإقبال على الانتخابات | 46,643 | 62.8 | -11.2 | ||
| حزب المحافظين hold | تأرجح | ||||
Elections in the 1990s
| General election 1997: Epsom and Ewell[9] | |||||
|---|---|---|---|---|---|
| الحزب | المرشح | الأصوات | % | ±% | |
| Conservative | Archie Hamilton | 24,717 | 45.6 | -14.6 | |
| Labour | Philip Woodford | 13,192 | 24.3 | +8.6 | |
| Liberal Democrats | John Vincent | 12,380 | 22.8 | -0.7 | |
| Referendum | Christopher Macdonald | 2,355 | 4.3 | ||
| UKIP | Harold Green | 544 | 1.0 | ||
| Green | Hugo Charlton | 527 | 1.0 | ||
| ProLife Alliance | Katherine Weeks | 466 | 0.9 | ||
| الأغلبية | 11,525 | 21.3 | |||
| الإقبال على الانتخابات | 54,181 | ||||
| حزب المحافظين hold | تأرجح | ||||
| General election 1992: Epsom and Ewell[10][11] | |||||
|---|---|---|---|---|---|
| الحزب | المرشح | الأصوات | % | ±% | |
| Conservative | Archie Hamilton | 32,861 | 60.2 | −2.0 | |
| Liberal Democrats | Martin P. Emerson | 12,840 | 23.5 | +0.3 | |
| Labour | Richard A. Warren | 8,577 | 15.7 | +1.2 | |
| Natural Law | GD Hatchard | 334 | 0.6 | N/A | |
| الأغلبية | 20,021 | 36.7 | −2.3 | ||
| الإقبال على الانتخابات | 54,612 | 80.1 | +4.8 | ||
| حزب المحافظين hold | تأرجح | −1.2 | |||
Elections in the 1980s
| General election 1987: Epsom and Ewell[12] | |||||
|---|---|---|---|---|---|
| الحزب | المرشح | الأصوات | % | ±% | |
| Conservative | Archie Hamilton | 33,145 | 62.2 | ||
| Liberal | Margaret Joachim | 12,384 | 23.24 | ||
| Labour | Barbara Follett | 7,751 | 14.55 | ||
| الأغلبية | 20,761 | 38.97 | |||
| الإقبال على الانتخابات | 75.38 | ||||
| حزب المحافظين hold | تأرجح | ||||
| General election 1983: Epsom and Ewell[13] | |||||
|---|---|---|---|---|---|
| الحزب | المرشح | الأصوات | % | ±% | |
| Conservative | Archie Hamilton | 30,737 | 60.43 | ||
| Liberal | Michael Anderson | 13,542 | 26.62 | ||
| Labour | WR Carpenter | 6,587 | 12.95 | ||
| الأغلبية | 17,195 | 33.80 | |||
| الإقبال على الانتخابات | 72.02 | ||||
| حزب المحافظين hold | تأرجح | ||||
. . . . . . . . . . . . . . . . . . . . . . . . . . . . . . . . . . . . . . . . . . . . . . . . . . . . . . . . . . . . . . . . . . . . . . . . . . . . . . . . . . . . . . . . . . . . . . . . . . . . . . . . . . . . . . . . . . . . . . . . . . . . . . . . . . . . . . . . . . . . . . . . . . . . . . . . . . . . . . . . . . . . . . . .
Elections in the 1970s
| General election 1979: Epsom and Ewell | |||||
|---|---|---|---|---|---|
| الحزب | المرشح | الأصوات | % | ±% | |
| Conservative | Archie Hamilton | 39,104 | 61.91 | +7.85 | |
| Liberal | M Anderson | 12,746 | 20.18 | -6.45 | |
| Labour | Chris Smith | 11,315 | 17.91 | -1.40 | |
| الأغلبية | 26,358 | 41.73 | +14.31 | ||
| الإقبال على الانتخابات | 76.91 | ||||
| حزب المحافظين hold | تأرجح | ||||
| By election 1978: Epsom and Ewell | |||||
|---|---|---|---|---|---|
| الحزب | المرشح | الأصوات | % | ±% | |
| Conservative | Archie Hamilton | 28,242 | 63.61 | +9.55 | |
| Labour | Anthony Mooney | 7,314 | 16.47 | -2.84 | |
| Liberal | Michael Alexander John Anderson | 5,673 | 12.78 | -13.85 | |
| Royalist | Jonathan King | 2,350 | 5.29 | N/A | |
| National Front | James Sawyer | 823 | 1.85 | N/A | |
| الأغلبية | 20,928 | 47.14 | +19.72 | ||
| الإقبال على الانتخابات | 44,402 | ||||
| حزب المحافظين hold | تأرجح | ||||
| General election October 1974: Epsom and Ewell | |||||
|---|---|---|---|---|---|
| الحزب | المرشح | الأصوات | % | ±% | |
| Conservative | Peter Rawlinson | 32,109 | 54.06 | ||
| Liberal | David Julian Hardy Griffiths | 15,819 | 26.63 | ||
| Labour | Neil Joseph Kearney | 11,471 | 19.31 | ||
| الأغلبية | 16,290 | 27.42 | |||
| الإقبال على الانتخابات | 73.70 | ||||
| حزب المحافظين hold | تأرجح | ||||
| General election February 1974: Epsom and Ewell | |||||
|---|---|---|---|---|---|
| الحزب | المرشح | الأصوات | % | ±% | |
| Conservative | Peter Rawlinson | 35,823 | 54.68 | -6.73 | |
| Liberal | David Julian Hardy Griffiths | 18,899 | 28.85 | +12.33 | |
| Labour | Neil Joseph Kearney | 10,787 | 16.47 | -5.59 | |
| الأغلبية | 16,924 | 25.83 | -13.52 | ||
| الإقبال على الانتخابات | 65,509 | 82.0 | N/A | ||
| حزب المحافظين فوز (مقعد جديد) | |||||
See also
الملاحظات والهامش
- الملاحظات
- الهامش
- ^ "Electorate Figures – Boundary Commission for England". 2011 Electorate Figures. Boundary Commission for England. 4 March 2011. Archived from the original on 6 November 2010. Retrieved 13 March 2011.
- ^ Leigh Rayment's Historical List of MPs – Constituencies beginning with "E" (part 2)
- ^ "STATEMENT OF PERSONS NOMINATED AND NOTICE OF POLL - Epsom and Ewell" (PDF). epsom-ewell.gov.uk.
- ^ "Epsom & Ewell parliamentary constituency". BBC News.
- ^ "Election Data 2015". Electoral Calculus. Archived from the original on 17 October 2015. Retrieved 17 October 2015.
- ^ "Election Data 2010". Electoral Calculus. Archived from the original on 26 July 2013. Retrieved 17 October 2015.
- ^ "Election Data 2005". Electoral Calculus. Archived from the original on 15 October 2011. Retrieved 18 October 2015.
- ^ "Election Data 2001". Electoral Calculus. Archived from the original on 15 October 2011. Retrieved 18 October 2015.
- ^ "Election Data 1997". Electoral Calculus. Archived from the original on 15 October 2011. Retrieved 18 October 2015.
- ^ "Election Data 1992". Electoral Calculus. Archived from the original on 15 October 2011. Retrieved 18 October 2015.
- ^ "Politics Resources". Election 1992. Politics Resources. 9 April 1992. Archived from the original on 24 July 2011. Retrieved 2010-12-06.
- ^ "Election Data 1987". Electoral Calculus. Archived from the original on 15 October 2011. Retrieved 18 October 2015.
- ^ "Election Data 1983". Electoral Calculus. Archived from the original on 15 October 2011. Retrieved 18 October 2015.
المصادر
- Election result, 2015 (BBC)
- Election result, 2010 (BBC)
- Election result, 2005 (BBC)
- Election results, 1997 – 2001 (BBC)
- Election results, 1997 – 2001 (Election Demon)
- Election results, 1983 – 1992 (Election Demon)
- Wikipedia articles incorporating an LRPP-MP template with two unnamed parameters
- Pages using gadget WikiMiniAtlas
- Articles containing إنگليزية-language text
- Pages using Lang-xx templates
- Coordinates on Wikidata
- Parliamentary constituencies in South East England
- إپسوم ويـُوِل
- United Kingdom Parliamentary constituencies established in 1974
- سياسية سري
- Mole Valley
- دوائر انتخابية في المملكة المتحدة

