مقياس لوغاريتمي
المقياس اللوغاريتمي logarithmic scale، هو معيار للقياس يستخدم لوغاريتم الكمية الفيزيائية بدلاً من الكمية ذاتها.
A simple example is a chart whose vertical axis has equally spaced increments that are labeled 1, 10, 100, 1000, instead of 1, 2, 3, 4. Each unit increase on the logarithmic scale thus represents an exponential increase in the underlying quantity for the given base (10, in this case).
Presentation of data on a logarithmic scale can be helpful when the data covers a large range of values. The use of the logarithms of the values rather than the actual values reduces a wide range to a more manageable size. Some of our senses operate in a logarithmic fashion (Weber–Fechner law), which makes logarithmic scales for these input quantities especially appropriate. In particular our sense of hearing perceives equal ratios of frequencies as equal differences in pitch. In addition, studies of young children in an isolated tribe have shown logarithmic scales to be the most natural display of numbers by humans.[1]
التعريف والقاعدة
أمثلة
On most logarithmic scales, small values (or ratios) of the underlying quantity correspond to negative values of the logarithmic measure. Well-known examples of such scales are:
- Richter magnitude scale and moment magnitude scale (MMS) for strength of earthquakes and movement in the earth.
- ban and deciban, for information or weight of evidence;
- bel and decibel and neper for acoustic power (loudness) and electric power;
- cent, minor second, major second, and octave for the relative pitch of notes in music;
- logit for odds in statistics;
- Palermo Technical Impact Hazard Scale;
- Logarithmic timeline;
- counting f-stops for ratios of photographic exposure;
- rating low probabilities by the number of 'nines' in the decimal expansion of the probability of their not happening: for example, a system which will fail with a probability of 10−5 is 99.999% reliable: "five nines".
- Entropy in thermodynamics.
- Information in information theory.
- Particle Size Distribution curves of soil
Some logarithmic scales were designed such that large values (or ratios) of the underlying quantity correspond to small values of the logarithmic measure. Examples of such scales are:
- pH for acidity and alkalinity;
- stellar magnitude scale for brightness of stars;
- Krumbein scale for particle size in geology.
- Absorbance of light by transparent samples.
الوحدات اللوغاريتمية
أمثلة
Examples of logarithmic units include common units of information and entropy, such as the bit [log 2] and the byte 8[log 2] = [log 256], also the nat [log e] and the ban [log 10]; units of relative signal strength magnitude such as the decibel 0.1[log 10] and bel [log 10], neper [log e], and other logarithmic-scale units such as the Richter scale point [log 10] or (more generally) the corresponding order-of-magnitude unit sometimes referred to as a factor of ten or decade (here meaning [log 10], not 10 years).
الحث
التمثيل البياني
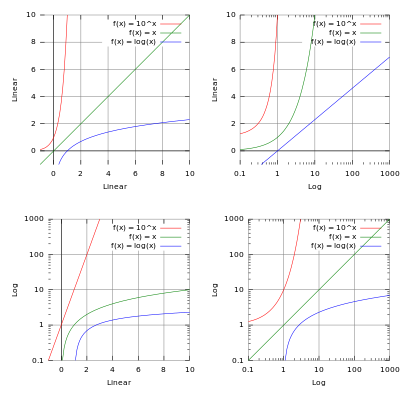
مقارنة المقاييس
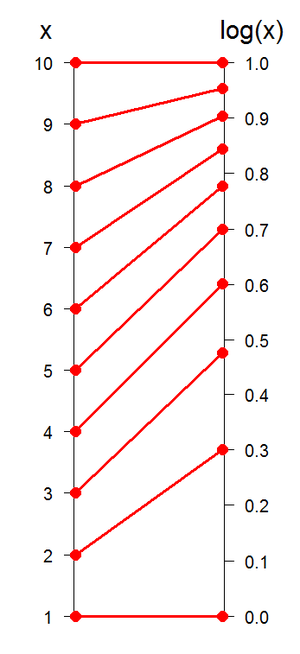
A plot of x v. log10(x). Note two things: first, log(x) increases quickly at first: by x = 3, log(x) is almost at .5; it is useful to remember that sqrt(10) ~ 3. Second, log(x) grows ever more slowly as x approaches 10; this shows how logarithms can be used to 'tame' large numbers.
Logarithmic and semi-logarithmic plots and equations of lines
Log and semilog scales are best used to view two types of equations (for ease, the natural base 'e' is used):
In the first case, plotting the equation on a semilog scale (log Y versus X) gives: log Y = −aX, which is linear.
In the second case, plotting the equation on a log-log scale (log Y versus log X) gives: log Y = b log X, which is linear.
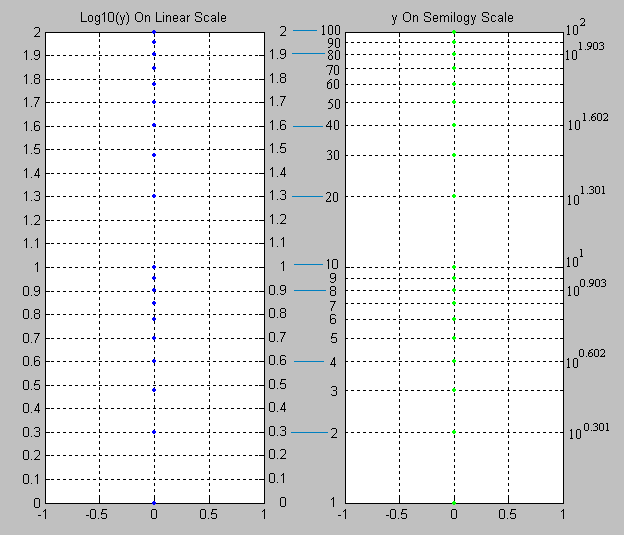
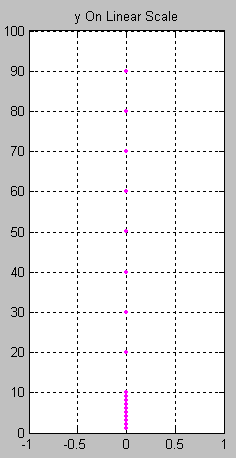
When values that span large ranges need to be plotted, a logarithmic scale can provide a means of viewing the data that allows the values to be determined from the graph. The logarithmic scale is marked off in distances proportional to the logarithms of the values being represented. For example, in the figure below, for both plots, y has the values of: 1, 2, 3, 4, 5, 6, 7, 8, 9 10, 20, 30, 40, 50, 60, 70, 80, 90 and 100. For the plot on the left, the log10 of the values of y are plotted on a linear scale. Thus the first value is log10(1) = 0; the second value is log10(2) = 0.301; the 3rd value is log10(3) = 0.4771; the 4th value is log10(4) = 0.602, and so on. The plot on the right uses logarithmic (or log, as it is also referred to) scaling on the vertical axis. Note that values where the exponent term is close to an integral fraction of 10 (0.1, 0.2, 0.3, etc.) are shown as 10 raised to the power that yields the original value of y. These are shown for y = 2, 4, 8, 10, 20, 40, 80 and 100.
Note that for y = 2 and 20, y = 100.301 and 101.301; for y = 4 and 40, y = 100.602 and 101.602. This is due to the law that
So, knowing log10(2) = 0.301, the rest can be derived:
Note that the values of y are easily picked off the above figure. By comparison, values of y less than 10 are difficult to determine from the figure below, where they are plotted on a linear scale, thus confirming the earlier assertion that values spanning large ranges are more easily read from a logarithmically scaled graph.
Log-log plots
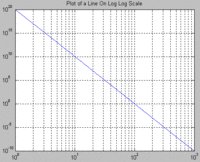
If both the vertical and horizontal axis of a plot is scaled logarithmically, the plot is referred to as a log-log plot.
Semi logarithmic plots
If only the ordinate or abscissa is scaled logarithmically, the plot is referred to as a semi logarithmic plot.
تقدير القيم في مخطط بواسطة المقياس اللوغاريتمي
- Measure the distance from the point on the scale to the closest decade line with lower value with a ruler.
- Divide this distance by the length of a decade (the length between two decade lines).
- The value of your chosen point is now the value of the nearest decade line with lower value times 10a where a is the value found in step 2.
انظر أيضاً
وحدات متعلقة بالمعلومات
وحدات متعلقة بالقوة المفردة
Scale
التطبيقات
- الكثافة البصرية [log 10]
المصادر
- ^ "Slide Rule Sense: Amazonian Indigenous Culture Demonstrates Universal Mapping Of Number Onto Space". ScienceDaily. 2008-05-30. Retrieved 2008-05-31.
which references: Stanislas, Dehaene (2008). "Log or linear? Distinct intuitions of the number scale in Western and Amazonian indigene cultures". Science. 320 (5880): 1217. doi:10.1126/science.1156540. PMC 2610411. PMID 18511690.{{cite journal}}: More than one of|pages=and|page=specified (help); Unknown parameter|coauthors=ignored (|author=suggested) (help)
وصلات خارجية
 Media related to مقياس لوغاريتمي at Wikimedia Commons

![{\displaystyle \mathrm {Log} (a)=(\log _{b}a)[\log b]=(\log _{c}a)[\log c].\,}](https://wikimedia.org/api/rest_v1/media/math/render/svg/003fed38c16c8d570ff548e21e1836bdd6bdcdac)

