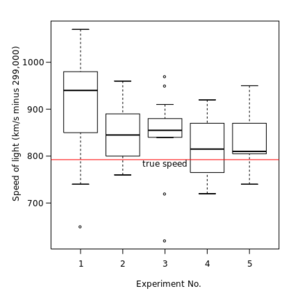
قيمة شاذة

في الإحصاء، القيمة الشاذة (outlier) هي عنصر شاذ وخارج عن النسق المميز لمجموعة أو تركيبة معينة. ففي عموم الدراسات في الإحصاء، الرياضياتيون أنجزوا خوارزميات قادرة على التخفيف من تأثير القيم الشاذة، أو إلغائها، وحتى حذفها، مستخدمين طرق الإحصاء المتين .إلا أنه في بعض الأحيان يكون وجودها مفيدا لمعرفة سلوك تركيبة، أو منظومة.
- أما القيمة المستحيلة (anomaly) فتعتبر قرائة خاطئة لأنها تدل على ظاهرة مستحيل حدوثها.
التعرف
في التعرف على الحالات الشاذة Anomaly
اختبار تومسون تاو المعدل
The modified Thompson Tau test[بحاجة لمصدر] is a method used to determine if an outlier exists in a data set. The strength of this method lies in the fact that it takes into account a data set’s standard deviation, average and provides a statistically determined rejection zone; thus providing an objective method to determine if a data point is an outlier. Note: Although intuitively appealing, this method appears to be unpublished (it is not described in Thompson (1985)[1]) and one should use it with caution.
كيف تعمل: First, a data set's average is determined. Next the absolute deviation between each data point and the average are determined. Thirdly, a rejection region is determined using the formula: ; where is the critical value from the Student t distribution, n is the sample size, and s is the sample standard deviation. To determine if a value is an outlier: Calculate δ = |(X - mean(X)) / s|. If δ > Rejection Region, the data point is an outlier. If δ ≤ Rejection Region, the data point is not an outlier.
The modified Thompson Tau test is used to find one outlier at a time (largest value of δ is removed if it is an outlier). Meaning, if a data point is found to be an outlier, it is removed from the data set and the test is applied again with a new average and rejection region. This process is continued until no outliers remain in a data set.
Some work has also examined outliers for nominal (or categorical) data. In the context of a set of examples (or instances) in a data set, instance hardness measures the probability that an instance will be misclassified ( where is the assigned class label and represent the input attribute value for an instance in the training set ).[2] Ideally, instance hardness would be calculated by summing over the set of all possible hypotheses :
Practically, this formulation is unfeasible as is potentially or infinite and calculating is unknown for many algorithms. Thus, instance hardness can be approximated using a diverse subset :
where is the hypothesis induced by learning algorithm trained on training set with hyperparameters . Instance hardness provides a continuous value for determining if an instance is an outlier instance.
انظر أيضاً
- Anomaly time series
- Robust regression
- Studentized residual
- Data transformation (statistics)
- Winsorizing
References
- ^ Thompson .R. (1985). "A Note on Restricted Maximum Likelihood Estimation with an Alternative Outlier Model".Journal of the Royal Statistical Society. Series B (Methodological), Vol. 47, No. 1, pp. 53-55
- ^ Smith, M.R.; Martinez, T.; Giraud-Carrier, C. (2014). "An Instance Level Analysis of Data Complexity". Machine Learning, 95(2): 225-256.
- ISO 16269-4, Statistical interpretation of data — Part 4: Detection and treatment of outliers
- Strutz, Tilo (2010). Data Fitting and Uncertainty - A practical introduction to weighted least squares and beyond. Vieweg+Teubner. ISBN 978-3-8348-1022-9.
وصلات خارجية
- Renze, John, قيمة شاذة at MathWorld.
- قالب:SpringerEOM
- Grubbs test described by NIST manual
- how to detect univariate outliers, how to detect multivariate outliers and how to deal with outliers