ملف:Correlation of gas production and seismicity Groningen Vlek 2019 EnvEarthSci 78(3) 59 fig 3.png
حجم هذه المعاينة: 487 × 600 بكسل. البعد الآخر: 1٬030 × 1٬268 بكسل.
الملف الأصلي (1٬030 × 1٬268 بكسل حجم الملف: 314 كيلوبايت، نوع MIME: image/png)
وصف قصير
| ⧼wm-license-information-description⧽ |
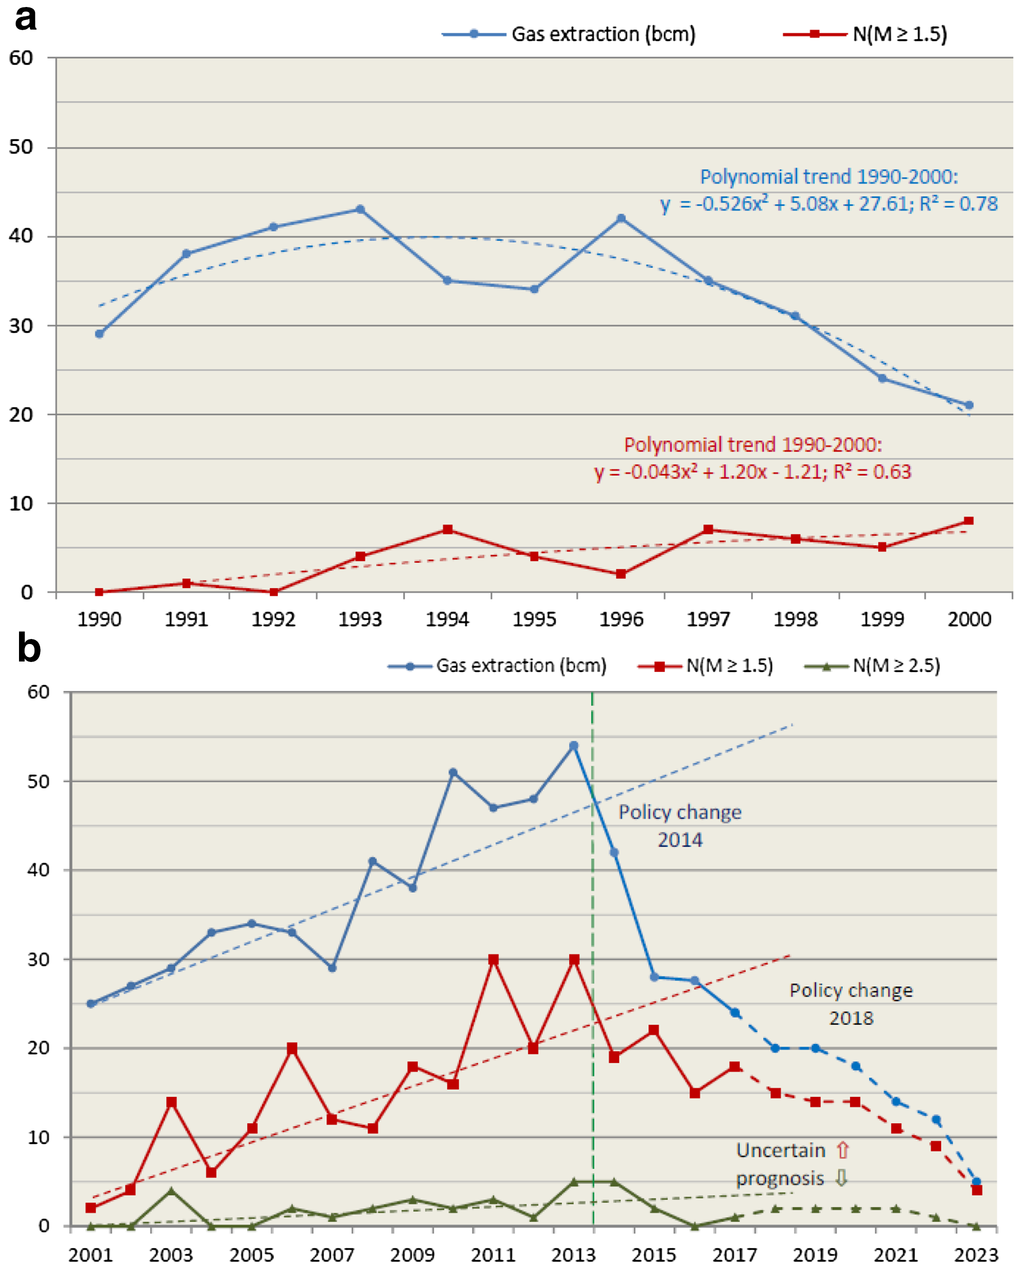
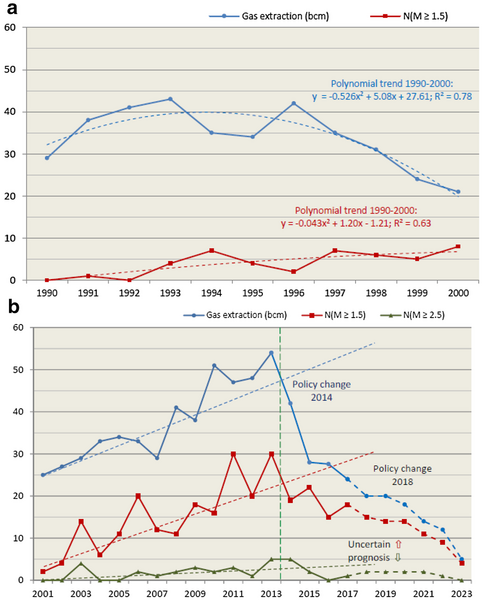
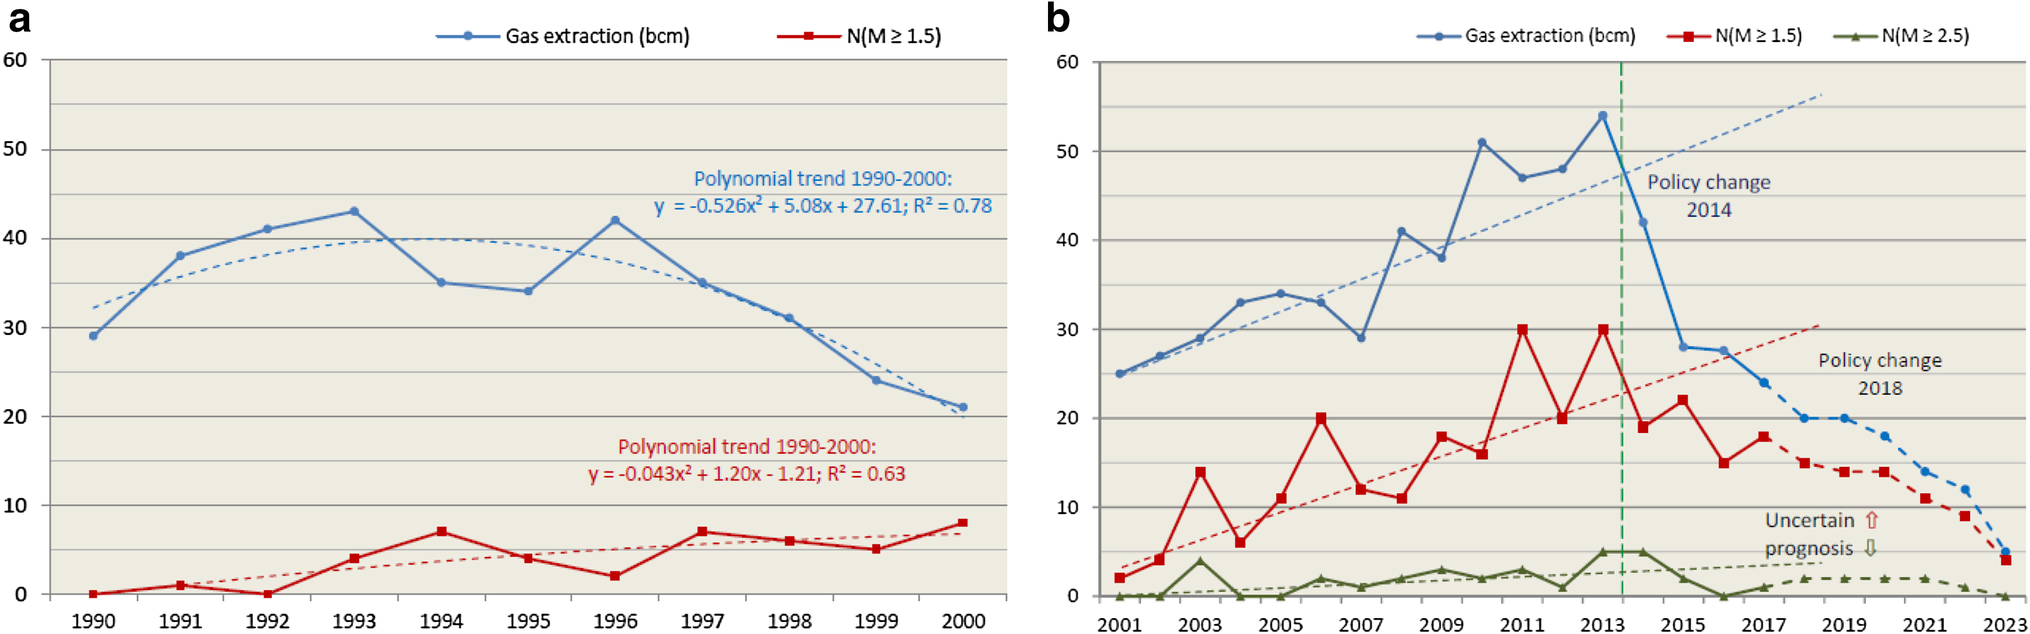
English: Original figure caption: a, b Annual gas extraction (bcm; upper curve) versus annual number (N) of earthquakes with M ≥ 1.5 and ≥ 2.5 (Richter; lower curves). The ordinate (y) fits both annual bcm and earthquake frequency. Basic data from NAM (2016a, 2018) and KNMI (2018). Statistical trends (dashed) over time have been separately fitted for periods 1990–2000 (a) and 2001–2013 (b), excluding 2014–2018.
Deutsch: Induzierte Seismizität im Gasfeld Groningen: Jährliche Erdgasförderung (in bcm = milliarden Kubikmeter; blaue obere Kurven) im Vergleich zur jährlichen Anzahl der Erdbeben (N) mit Magnituden ≥1,5 und ≥2,5 (Richterskala; rote bzw. grüne untere Kurve(n)). Die Zahlen an der Ordinate (y-Achse) gelten jeweils für alle Kurven. Die Rohdaten stammen von NAM (2016a, 2018) und KNMI (2018). Die Steigung der Trendlinien (gestrichelt) ist für die Zeiträume 1990–2000 (a) und 2001–2013 (b) jeweils separat berechnet worden, abzüglich des Zeitraumes von 2014–2018.
|
| ⧼wm-license-information-date⧽ | 2019-01-18 (original online publication date) |
| ⧼wm-license-information-source⧽ | Fig. 3 in: Rise and reduction of induced earthquakes in the Groningen gas field, 1991–2018: statistical trends, social impacts, and policy change. Environmental Earth Sciences 78(3):59, doi:10.1007/s12665-019-8051-4 |
| ⧼wm-license-information-author⧽ |
|
| ⧼wm-license-information-permission⧽ (⧼wm-license-information-permission-reusing-text⧽) |
The original version of this image was published in Environmental Earth Sciences journal. On the webpage that contains the HTML version of the respective article (link.springer.com, see DOI link above) it is stated that it “is distributed under the terms of the Creative Commons Attribution 4.0 International License (https://creativecommons.org/licenses/by/4.0/)”. |
ترخيص
تاريخ الملف
اضغط على زمن/تاريخ لرؤية الملف كما بدا في هذا الزمن.
| زمن/تاريخ | صورة مصغرة | الأبعاد | مستخدم | تعليق | |
|---|---|---|---|---|---|
| حالي | ★ مراجعة معتمدة 02:33، 30 أكتوبر 2023 | | 1٬030 × 1٬268 (314 كيلوبايت) | Pastakhov (نقاش | مساهمات) | Upload https://upload.wikimedia.org/wikipedia/commons/5/5c/Correlation_of_gas_production_and_seismicity_Groningen_Vlek_2019_EnvEarthSci_78%283%29_59_fig_3.png |
لا يمكنك استبدال هذا الملف.
وصلات
لا يوجد صفحات تصل لهذه الصورة.
_59_fig_3.png&oldid=3292739)