ملف:Asian Americans by state.svg

حجم معاينة PNG لذلك الملف ذي الامتداد SVG: 800 × 396 بكسل. البعد الآخر: 2٬560 × 1٬266 بكسل.
الملف الأصلي (ملف SVG، أبعاده 1٬199 × 593 بكسل، حجم الملف: 81 كيلوبايت)
وصف قصير
| ⧼wm-license-information-description⧽ |
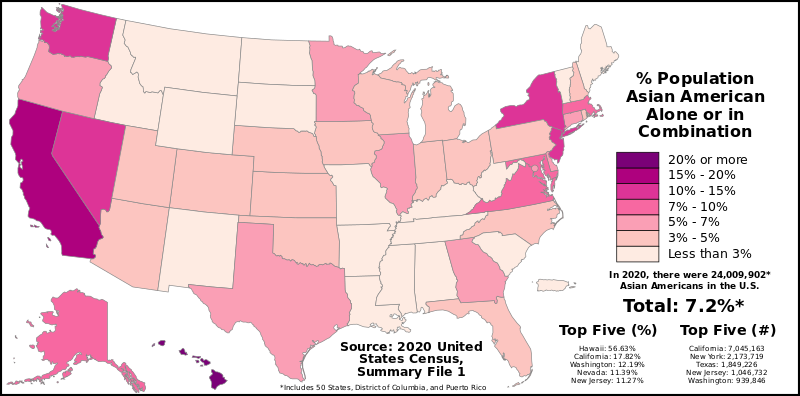
English: The map above shows the proportion of Asian Americans (alone or in combination) in each U.S. state, the District of Columbia, and Puerto Rico according to the official results of the 2020 United States Census. The data can be found here.
This file should next be updated when the 2021 Vintage Racial and Ethnic Population Estimates are released on the statewide level, currently expected to occur in June 2022. Legend 20% or more
15% - 20%
10% - 15%
7% - 10%
5% - 7%
3% - 5%
Less than 3% |
| ⧼wm-license-information-date⧽ | 2020 |
| ⧼wm-license-information-source⧽ | ⧼Wm-license-own-work⧽ |
| ⧼wm-license-information-author⧽ | Abbasi786786 |
ترخيص
|
تاريخ الملف
اضغط على زمن/تاريخ لرؤية الملف كما بدا في هذا الزمن.
| زمن/تاريخ | صورة مصغرة | الأبعاد | مستخدم | تعليق | |
|---|---|---|---|---|---|
| حالي | ★ مراجعة معتمدة 21:33، 16 نوفمبر 2023 | | 1٬199 × 593 (81 كيلوبايت) | Pastakhov (نقاش | مساهمات) | Upload https://upload.wikimedia.org/wikipedia/commons/2/28/Asian_Americans_by_state.svg |
لا يمكنك استبدال هذا الملف.
وصلات
لا يوجد صفحات تصل لهذه الصورة.