ملف:Soi-map.png
لا توجد دقة أعلى متوفرة.
Soi-map.png (717 × 379 بكسل حجم الملف: 18 كيلوبايت، نوع MIME: image/png)
وصف قصير
| ⧼wm-license-information-description⧽ |
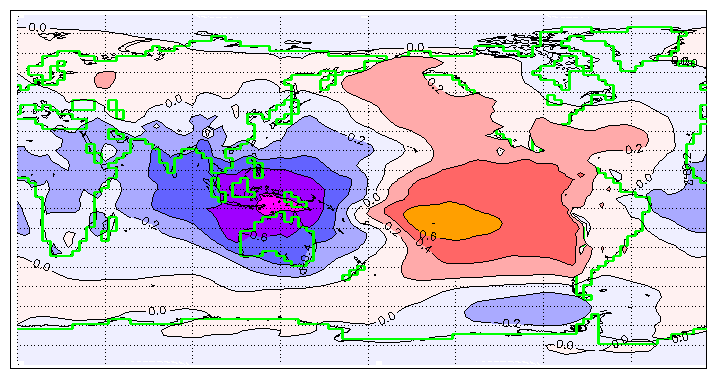
English: Southern oscillation index correlated with mean sea level pressure; calculated from monthly deseasonalised data from ERA-15.
|
||||
| ⧼wm-license-information-date⧽ | |||||
| ⧼wm-license-information-source⧽ | ⧼Wm-license-own-work⧽ | ||||
| ⧼wm-license-information-author⧽ | By William M. Connolley. | ||||
| ⧼wm-license-information-other-versions⧽ |
|
||||

ترخيص
تاريخ الملف
اضغط على زمن/تاريخ لرؤية الملف كما بدا في هذا الزمن.
| زمن/تاريخ | صورة مصغرة | الأبعاد | مستخدم | تعليق | |
|---|---|---|---|---|---|
| حالي | ★ مراجعة معتمدة 09:30، 7 أكتوبر 2023 | | 717 × 379 (18 كيلوبايت) | Pastakhov (نقاش | مساهمات) | Upload https://upload.wikimedia.org/wikipedia/commons/9/98/Soi-map.png |
لا يمكنك استبدال هذا الملف.
وصلات
لا يوجد صفحات تصل لهذه الصورة.