ملف:Sea-level variations from Sentinel-3A ESA359994.jpg

الملف الأصلي (1٬173 × 870 بكسل حجم الملف: 996 كيلوبايت، نوع MIME: image/jpeg)
وصف قصير
| ⧼wm-license-information-description⧽ |
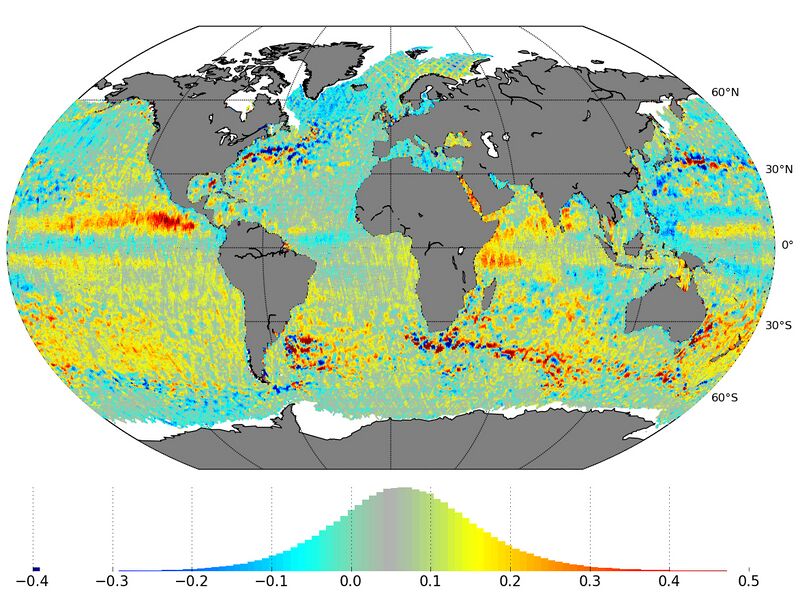
English: Presented this week at ESA’s Living Planet Symposium in the Czech Republic, this new map shows a month of ‘sea-level anomaly’ measurements from Sentinel-3A. The satellite has only been in orbit since 16 February 2016 and is therefore still being commissioned for service. Nevertheless, measurements made by its radar altimeter between 3 March and 2 April have been used to create this map, which shows differences in sea-surface height compared to the mean.
Sea-level anomaly is the most basic altimeter data product. Red (positive) areas show where the sea surface is higher than the reference sea level and blue (negative) areas show where it is lower. Positive anomalies are associated with warmer waters and a deeper ‘thermocline’ and negative anomalies are associated with cooler waters and a shallower ‘thermocline’ – the transition layer between warmer mixed water at the ocean's surface and cooler deep water below. The plot at the base of the sea-level anomaly map shows the normalised distribution of data, indicating a global mean of 7 cm and a standard deviation of 11 cm. Using local sea-level variations measured by Sentinel-3’s altimeter and comparing them to a reference level, major ocean currents can be computed and mapped. Mesoscale eddy systems are clearly shown on the map as more intense blue and red patterns – effectively local hills and valleys in the sea surface. These are associated with the strong western boundary currents of the Gulf Stream in the North Atlantic, the Brazil current confluence with the Falklands current in the southeast Atlantic, the Benguela current off South Africa and the Kurishio current east of Japan. Strong positive variability is also seen in the equatorial Pacific Ocean associated with oceanic tropical instability waves generated by instabilities within the equatorial currents themselves. The Sentinel-3A radar altimeter will also measure significant wave height and provide estimates of surface wind speeds over the ocean, which is important information for ocean and wave forecasting systems operated by the Copernicus Marine Environmental Monitoring Service. The radar altimeter data in this map were processed using France’s CNES space agency’s processing prototype (S3PP), with ESA level-0 data as input. A wet tropospheric correction was derived from European Centre for Medium-Range Weather Forecasts’ models. |
| ⧼wm-license-information-date⧽ | 2016 |
| ⧼wm-license-information-source⧽ | http://www.esa.int/spaceinimages/Images/2016/05/Sea-level_variations_from_Sentinel-3A |
| ⧼wm-license-information-author⧽ | European Space Agency |
| ⧼wm-license-information-permission⧽ (⧼wm-license-information-permission-reusing-text⧽) |
contains modified Copernicus Sentinel data (2016), processed by ESA and CNES,CC BY-SA 3.0 IGO |
| ⧼wm-license-information-other-versions⧽ |
|
| Title | Sea-level variations from Sentinel-3A |
| Set | Living Planet Symposium 2016 |
| Mission | Sentinel-3 |
| Activity | Observing the Earth |
ترخيص
تاريخ الملف
اضغط على زمن/تاريخ لرؤية الملف كما بدا في هذا الزمن.
| زمن/تاريخ | صورة مصغرة | الأبعاد | مستخدم | تعليق | |
|---|---|---|---|---|---|
| حالي | ★ مراجعة معتمدة 16:31، 30 نوفمبر 2023 | | 1٬173 × 870 (996 كيلوبايت) | Pastakhov (نقاش | مساهمات) | Upload https://upload.wikimedia.org/wikipedia/commons/2/2e/Sea-level_variations_from_Sentinel-3A_ESA359994.jpg |
لا يمكنك استبدال هذا الملف.
وصلات
لا يوجد صفحات تصل لهذه الصورة.