ملف:Largenumbers.svg

حجم معاينة PNG لذلك الملف ذي الامتداد SVG: 600 × 480 بكسل. البعد الآخر: 2٬560 × 2٬048 بكسل.
الملف الأصلي (ملف SVG، أبعاده 600 × 480 بكسل، حجم الملف: 22 كيلوبايت)
وصف قصير
| ⧼wm-license-information-description⧽ |
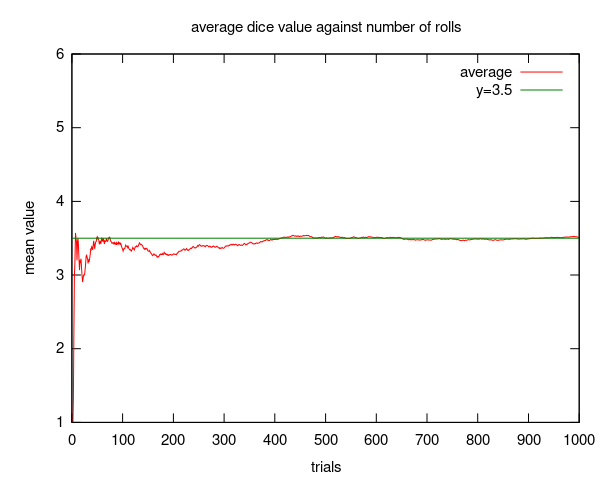
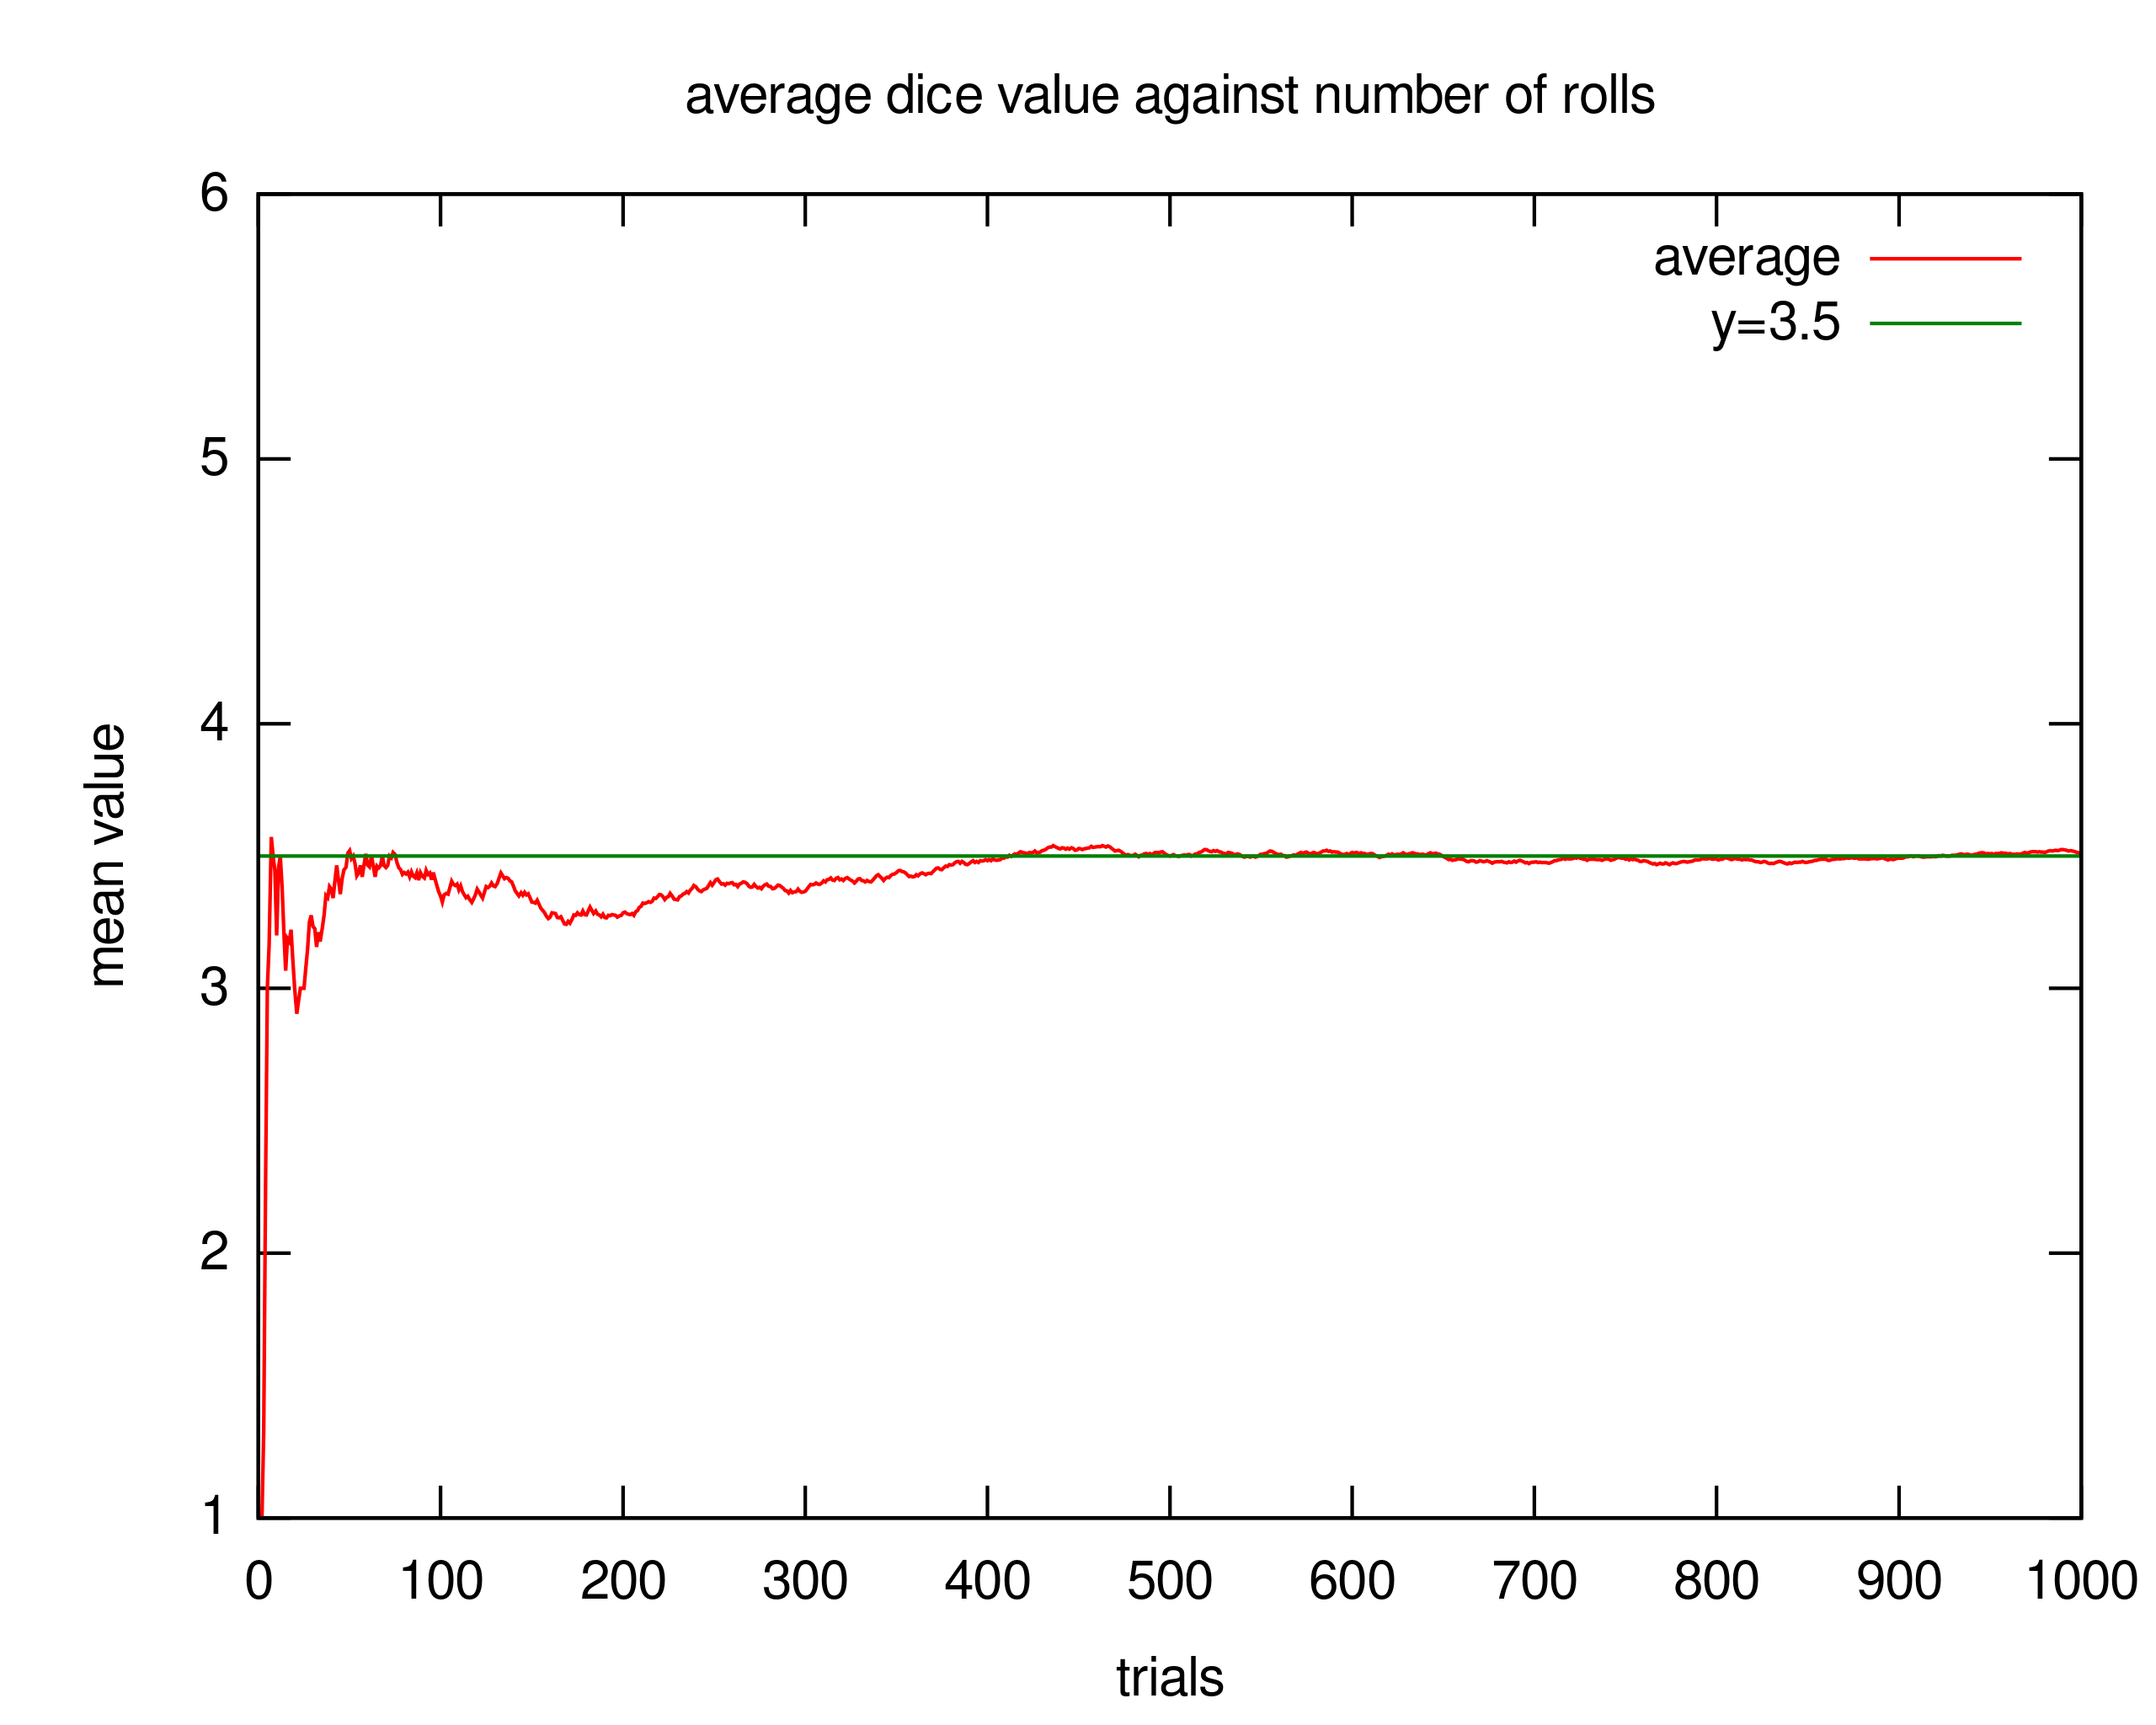
English: An illustration of the w:law of large numbers, similar to File:LLN_Die_Rolls.gif but using the svg format instead of gif. This uses different data from that and hence it looks different. Source code is in the section below. The code is under the same "license" as the work itself.
|
| ⧼wm-license-information-date⧽ | 2010-01-31 23:04 (UTC) |
| ⧼wm-license-information-source⧽ | ⧼Wm-license-own-work⧽ |
| ⧼wm-license-information-author⧽ | NYKevin |
| ⧼wm-license-information-other-versions⧽ |
Source code
Note that you will need to insert some paths. I've tried to make it obvious where to do so.
This code is all in the public domain (the cc0 waiver applies to it)
The code (in Java) which generated the data:
import java.io.*;
public class Main {
    public static void main(String[] args) {
        PrintStream output=null;
        try{
            output=new PrintStream("");//FIXME Insert a suitable path in the quote marks
        }catch(FileNotFoundException e){
            throw new RuntimeException(e);
        }
        //int diceValues[] = {0,0,0,0,0,0};//this variable may be uncommented and used for debugging
        double average=0;
        double total=0;
        output.println("#count average");//makes a header for the data; may be safely removed
        Random rnd=new Random(4124484382302655524l);
        //seed selected by trial and error
        for(int i=1;i<=1000;i++){
            int rand=rnd.nextInt(6);//now holds a random int from 0 to 5
            //diceValues[rand]++;//uncomment for debugging
            rand++;//convert to 1-indexed
            total+=rand;
            average=total/i;
            output.println(i+" "+(average));
        }
        //System.out.println(average);
    }

}
The gnuplot code:
set terminal svg
set output "OUTPUT PATH HERE"
set title "average dice value against number of rolls"
set xlabel "trials"
set ylabel "mean value"
plot [] [1:6] "PATH FROM JAVA CODE HERE" title "average" with lines, 3.5 title "y=3.5" with lines
#it is recommended that you copy and paste this code into a .plt file and run it in batch mode:
#If you must run this interactively, be sure to type "exit" or ^D (control-D) at the end,
#or gnuplot will leave off the </svg> closing tag.
MATLAB/Octave Source code
% Specify how many trials you want to run:
num_trials = 1000;

% Now grab all the dice rolls:
trials = randi(6, [1 num_trials]);

% Plot the results:
figure(1);

% Cumulative sum of the trial results divided by the index gives the
% average:
plot(cumsum(trials)./(1:num_trials), 'r-');

% Let's put a reference line at 3.5 just for fun (make the color a darker
% green as well):
hold on;
plot([1 num_trials], [3.5 3.5], 'color', [0 0.5 0]);

% Make it look pretty:
title('average dice value against number of rolls');
xlabel('trials');
ylabel('mean value');
legend('average', 'y=3.5');
axis([0 num_trials 1 6]);
ترخيص
تاريخ الملف
اضغط على زمن/تاريخ لرؤية الملف كما بدا في هذا الزمن.
| زمن/تاريخ | صورة مصغرة | الأبعاد | مستخدم | تعليق | |
|---|---|---|---|---|---|
| حالي | ★ مراجعة معتمدة 20:24، 20 أكتوبر 2023 | | 600 × 480 (22 كيلوبايت) | Pastakhov (نقاش | مساهمات) | Upload https://upload.wikimedia.org/wikipedia/commons/f/f9/Largenumbers.svg |
لا يمكنك استبدال هذا الملف.
وصلات
لا يوجد صفحات تصل لهذه الصورة.