ملف:Comparison gender life expectancy WHO.svg

حجم معاينة PNG لذلك الملف ذي الامتداد SVG: 512 × 407 بكسل. البعد الآخر: 2٬560 × 2٬035 بكسل.
الملف الأصلي (ملف SVG، أبعاده 512 × 407 بكسل، حجم الملف: 85 كيلوبايت)
وصف قصير
| ⧼wm-license-information-description⧽ |
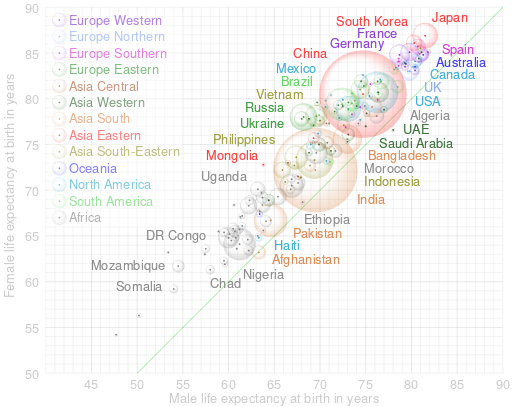
English: This is an interactuve bubble chart of comparison of countries by life expectancy at birth according to estimation of the World Health Organization for 2019. Open the original svg-file in separate window and hover over a bubble or lettering to highlight related content and to see detail information. The diagonal green line corresponds to equal female and male life expectancy. Square of bubles is proportional to the population of countries, according to estimation of the United Nations for 2019 (link 2). The diagram shows only countries with population of at least 1,000,000 people. Grouping of countries to subregions is according to the classification of the United Nations.
This is a derivative work of the diagram "File:Comparison gender life expectancy CIA factbook.svg". |
| ⧼wm-license-information-date⧽ | 2022 |
| ⧼wm-license-information-source⧽ | ⧼Wm-license-own-work⧽ |
| ⧼wm-license-information-author⧽ | Lady3mlnm |
| ⧼wm-license-information-other-versions⧽ |
Russian version of the chart: File:Comparison gender life expectancy WHO -ru.svg |
ترخيص
تاريخ الملف
اضغط على زمن/تاريخ لرؤية الملف كما بدا في هذا الزمن.
| زمن/تاريخ | صورة مصغرة | الأبعاد | مستخدم | تعليق | |
|---|---|---|---|---|---|
| حالي | ★ مراجعة معتمدة 15:30، 4 نوفمبر 2023 | | 512 × 407 (85 كيلوبايت) | Pastakhov (نقاش | مساهمات) | Upload https://upload.wikimedia.org/wikipedia/commons/5/52/Comparison_gender_life_expectancy_WHO.svg |
لا يمكنك استبدال هذا الملف.
وصلات
لا يوجد صفحات تصل لهذه الصورة.