ملف:U.S. Temperature Climate Normals.png

حجم هذه المعاينة: 800 × 340 بكسل. البعد الآخر: 1٬179 × 501 بكسل.
الملف الأصلي (1٬179 × 501 بكسل حجم الملف: 603 كيلوبايت، نوع MIME: image/png)
وصف قصير
| ⧼wm-license-information-description⧽ |
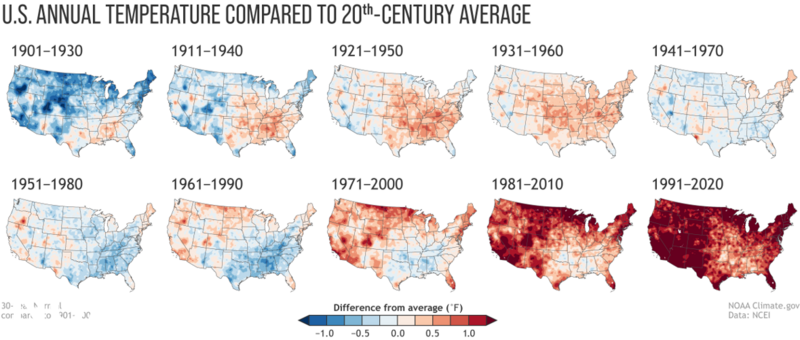
English: "Annual U.S. temperature compared to the 20th-century average for each U.S. Climate Normals period from 1901-1930 (upper left) to 1991-2020 (lower right). The U.S. Climate Normals collection has 10 versions: 1901-1930, 1911-1940 and so on through 1991-2020. In the image below, we’ve compared the U.S. annual average temperature during each Normals period to the 20th-century average (1901-2000). The influence of long-term global warming is obvious: The earliest map in the series has the most widespread and darkest blues, and the most recent map has the most widespread and darkest reds."
|
| ⧼wm-license-information-date⧽ | 2021 |
| ⧼wm-license-information-source⧽ | "The new U.S. Climate Normals are here. What do they tell us about climate change?" NOAA, May 4, 2021] |
| ⧼wm-license-information-author⧽ | National Oceanic and Atmospheric Administration (NOAA) National Centers for Environmental Information (NCEI) |
ترخيص
تاريخ الملف
اضغط على زمن/تاريخ لرؤية الملف كما بدا في هذا الزمن.
| زمن/تاريخ | صورة مصغرة | الأبعاد | مستخدم | تعليق | |
|---|---|---|---|---|---|
| حالي | ★ مراجعة معتمدة 22:46، 19 يناير 2024 | | 1٬179 × 501 (603 كيلوبايت) | Pastakhov (نقاش | مساهمات) | Upload https://upload.wikimedia.org/wikipedia/commons/5/57/U.S._Temperature_Climate_Normals.png |
لا يمكنك استبدال هذا الملف.
وصلات
لا يوجد صفحات تصل لهذه الصورة.